Home / Blog / Brokerage Firm Rankings: 7 Sources That Count Agents
Brokerage Firm Rankings: 7 Sources That Count Agents
ProfessionLens, 2026-11-10
Is a brokerage firm ranking measuring the number of agents on a company's roster, the business those agents produce, or figures firms submit to a survey? Those measures answer different questions, so the leading firms can change from one list to another. A licensing-record count can show how many professionals hold licenses associated with a geography or employer, but not necessarily how many are actively closing deals. A survey may capture reported firm performance, while production rankings compare activity such as transaction sides or sales volume.
That makes “largest brokerage” an incomplete description unless the ranking names its unit, coverage and reference date. The seven sources below range from aggregate counts based on public records to survey-led and production-based comparisons. For each, the useful question is what its rows represent, how readers can check them, and whether the measure fits workforce research, residential production or commercial brokerage activity.
Table of Contents
- 1. Real Estate Agent Database
- 2. Real Estate Almanac Mega 1000
- 3. RISMedia Power Broker Report
- 4. RealTrends Verified
- 5. Real Estate News U.S. Brokerage Rankings
- 6. Commercial Property Executive Top CRE Brokerage Firms
- 7. Commercial Property Executive CPE Book of Rankings
- Brokerage firm rankings compared
- Picking the Right Ranking for Your Question
1. Real Estate Agent Database
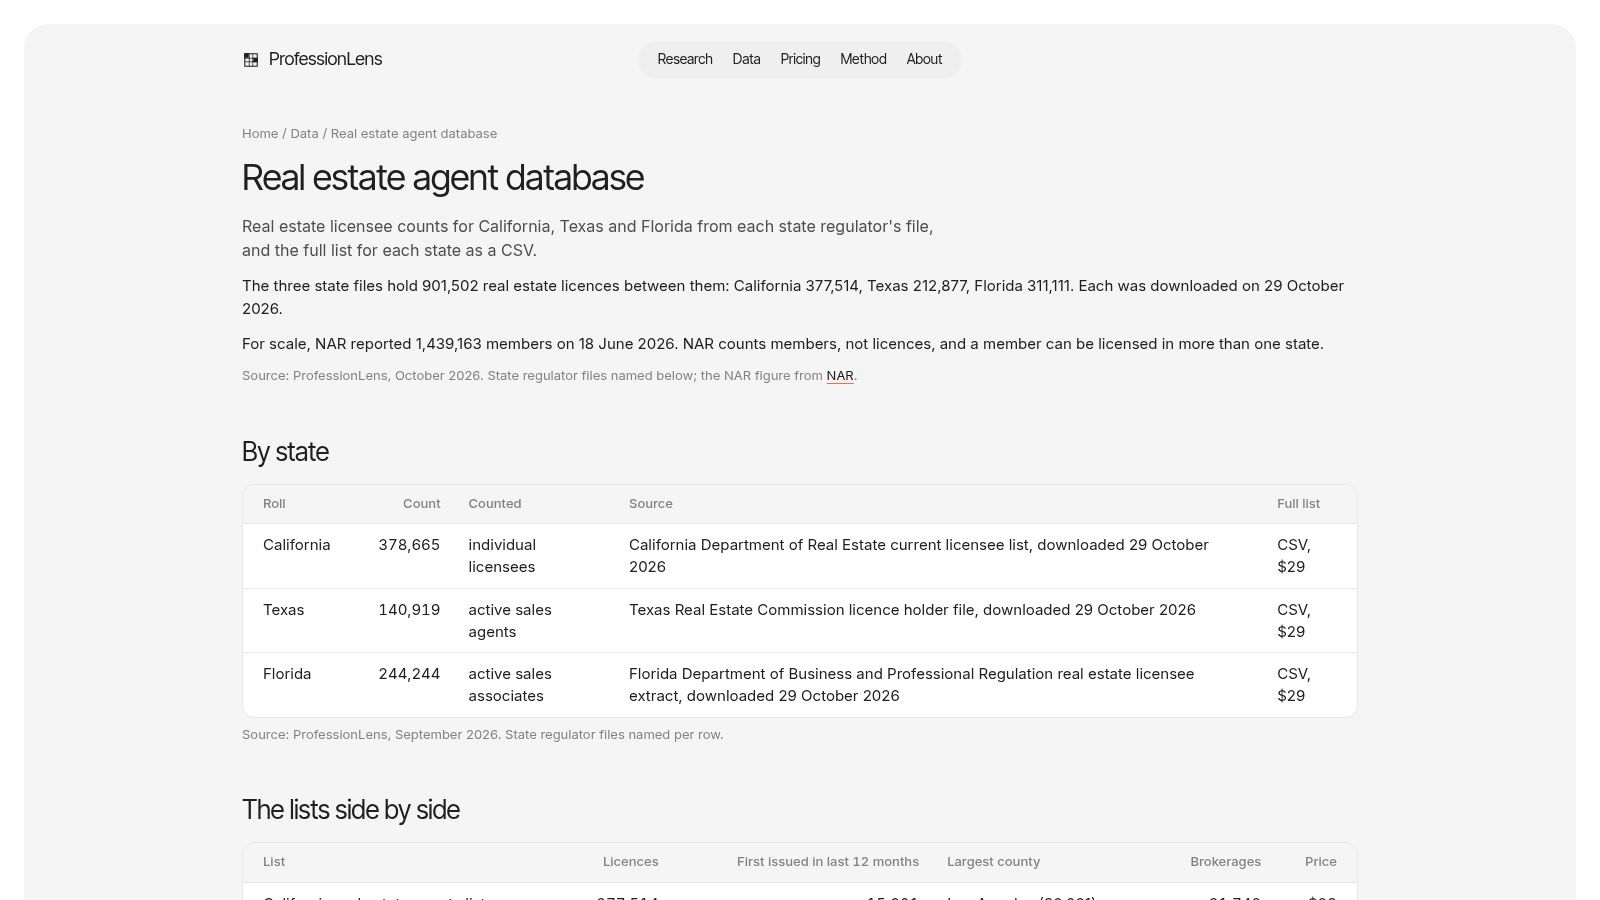
The ProfessionLens Real Estate Agent Database is a workforce reference, not a directory for finding individual agents. It organizes aggregate real-estate-agent counts using public licensing records, with source details, count dates and methods documented so researchers can assess what each figure includes. That distinction matters: a count of licensees is not automatically a count of active producers.
The database is most useful when the research question concerns the size or geographic distribution of the licensed workforce, or how counts vary by employer where that information is available. Public count pages are free to read and cite; selected full datasets are offered separately as CSV downloads. The results depend on the underlying records and their reference date, so readers should use the page's source and method notes when interpreting or citing a count.
What the count can and can't establish
An administrative roster can include people who hold a license but don't produce transactions during the period being studied. A 2025 brokerage production study illustrates why the distinction matters: it excluded inactive roster members and counted agents with at least one recorded non-lease transaction, while also warning that its customer sample wasn't nationally representative. That is a production-based definition, not just a license count.
ProfessionLens's aggregate format is useful for workforce comparisons and checking employer-size claims, but it doesn't provide names or contact details. Treat it as a dated measure of the population represented in the records, not as proof that every counted person is currently selling homes. For questions about who closed business, pair the count with a production source that spells out its activity threshold.
2. Real Estate Almanac Mega 1000
The Real Estate Almanac brokerage rankings let readers compare firms using agent count, sales volume and transaction sides. Its annual tables cover a broad set of residential brokerages, making the source more useful for examining differences among firms than a short list of leading brands. But those measures aren't interchangeable: headcount describes reported organizational scale, while sides and volume describe production.
The coverage itself helps put production concentration in context. In reporting on the 2025 Mega 1000, Real Estate News said the 1,000 ranked firms accounted for 64.1% of U.S. residential sales volume in 2024, or $2.1 trillion. That is a statement about the ranked firms' share of sales volume, not a count of agents or a census of every brokerage.

Read the measure beside the rank
In the same ranking, Real Estate News reported Compass at the top with more than $231 billion in 2024 sales volume. Use that figure as a sales-volume result for the stated year, not as evidence that Compass has the most agents or the most transactions. Annual tables are also snapshots, so a reader comparing editions should keep the reporting period and measure consistent.
For brokerage-size comparisons across several definitions, the largest real estate brokerages guide can help frame what each measure captures. The Almanac's advantage is its breadth and multiple ranking views; its limitation is that it isn't a complete count compiled from public licensing records. Check which column supports the claim before repeating a rank.
3. RISMedia Power Broker Report
The RISMedia Power Broker Report is an annual, survey-based ranking of residential brokerages, with a Top 1,000 list and accompanying industry reporting and interviews. It is useful when the question is how firms report their production and performance within an established residential-industry comparison. The survey basis should stay attached to the result: a submitted figure and a count assembled from licensing files don't describe the same underlying population.
Use it as a reported-performance source
Survey participation and verification requirements can affect which firms appear and what information is available. As a result, absence from the ranking shouldn't be read as evidence that a firm has no agents or no production. Nor should a reported firm figure be presented as an independently compiled count of licensed professionals.
The report's editorial context adds value when a researcher wants to understand how firms describe their operating results, rather than only sort rows by a metric. For workforce analysis, however, its survey design makes it a complement to public-record counts, not a substitute. Before citing a position, identify the edition, the reported measure and whether the underlying figures are survey responses or another form of verified submission.
4. RealTrends Verified
RealTrends Verified is best treated as a production benchmark. Its data downloads offer brokerage comparisons using measures such as transaction sides and sales volume, with separate rankings for agents and teams. The available results are based on submitted and verified production, so they show performance within that process rather than the total number of licensed people affiliated with every brokerage.
A concrete example clarifies the unit. HousingWire reported that eXp Realty ranked first by transaction sides in the 2024 RealTrends 500, with 355,052 sides recorded in 2023. That is a sides-based result for the stated year. It shouldn't be restated as an agent-count ranking or confused with a count of unique transactions without checking the ranking's definitions.
Best fit for production comparisons
RealTrends is a stronger choice than a roster count when the research question is which firms submitted high production under a comparable ranking method. Historical downloads can support trend analysis, although access to underlying files may require payment. For a longitudinal comparison, use the same measure across editions and check whether the method or participating firms changed.
The key limitation is coverage: verification can improve confidence in submitted production, but it doesn't turn a ranking into a census of all brokerages or all licensees. If the question is how many agents work under a firm, use a headcount source and state whether it counts licensed, rostered or active producers.
5. Real Estate News U.S. Brokerage Rankings
Real Estate News reports on brokerage rankings, sales-volume comparisons and shifts in firm position. Its value is explanatory: articles can connect a change in rank to consolidation or to how a company's reported results are assembled. It's journalism and analysis, not a public database where readers can inspect every firm-level row and download a full ranking file.
The issue is especially clear when companies combine through acquisitions. In its coverage of the 2025 brokerage sector, Real Estate Almanac reported that Compass's results included six brokerages acquired during the year, with 245,173 transaction sides and $262.23 billion in volume. The result therefore reflects an expanded group that includes acquired firms, not just the pre-acquisition business. A comparison of legal entities, consumer-facing brands and parent companies could produce different interpretations of “largest.”
Separate rank movement from organic growth
That distinction matters for policy and market analysis. A higher rank can reflect acquisitions, geographic reach or exposure to higher-priced transactions, as well as growth in the existing business. An article may explain those factors, but readers should look for the underlying ranking's definition before treating a narrative summary as a full method statement.
For company-specific context, ProfessionLens's Compass page offers an employer-count perspective that differs from sales-volume coverage. Use the two kinds of evidence for separate questions: one concerns professional headcount, the other reported brokerage production and how corporate groupings affect it.
6. Commercial Property Executive Top CRE Brokerage Firms
A commercial brokerage ranking answers a different question from a residential one. The Commercial Property Executive Top CRE Brokerage Firms ranking compares firms on reported investment-sales and leasing activity, publishing separate views for each activity alongside a combined list. That scope fits questions about commercial business; residential agent counts and home-sale production sit outside it.
Component views carry the detail
Investment sales and leasing describe different work, and a firm can rank higher on one view than on the other. Reading only the combined list erases that difference. Both views also rest on firm-reported figures: an evidence base that records how much business firms said they did. Counts consolidated from public licensing records measure something else entirely, the licensed professionals working under each firm.
Keep the sectors separate: A commercial activity ranking can identify firms by reported brokerage business, but it doesn't tell you how many licensed residential agents they employ.
Related research questions call for different material. For prospecting work on the commercial side, ProfessionLens offers downloadable lists at a one-time charge per list, including a commercial real estate agency list. The CPE ranking itself measures reported commercial activity and does not show how many licensed residential agents a firm employs.
7. Commercial Property Executive CPE Book of Rankings
The CPE Book of Rankings places brokerage firms within a broader collection of commercial real estate company comparisons. Its brokerage view considers investment sales and leasing and incorporates performance across multiple years, according to the ranking description. That wider frame can help readers compare commercial firms alongside other kinds of CRE businesses.
A broader view with a composite method
The multi-year approach is useful when a single year might not answer the question a researcher has about sustained activity. But a composite ranking also depends on the selected measures and how they're combined. If “largest” means the firm with the most current-year sales, a multi-year composite may not match that definition.
This source remains commercial-sector evidence. It doesn't replace residential rankings, public license counts or a complete workforce dataset. Use it when the research question concerns commercial brokerage performance over the period and according to the publication's chosen criteria. For a defensible comparison, name the ranking, its commercial scope and the measures it uses rather than describing the result as a general brokerage headcount.
Brokerage firm rankings compared
| Source | Sector | Primary ranking measure | Data basis | Public access |
|---|---|---|---|---|
| Real Estate Agent Database | U.S. real estate agents | Aggregate counts by geography and, where available, employer | Public licensing records; documented sources, dates, and methods | Free public count pages; selected datasets available as paid CSVs |
| Real Estate Almanac, Mega 1000 | U.S. residential brokerages | Agent count, sales volume, and transaction sides | Annual industry data | Searchable public tables |
| RISMedia, Power Broker Report | U.S. residential brokerages | Reported brokerage production and performance | Annual survey of brokerages | Some content may require membership or paid access |
| RealTrends Verified | Real estate brokerages, agents, and teams | Transaction sides and sales volume | Submitted and verified production data; 2026 rankings use 2025 data | Rankings available; underlying brokerage downloads are paid |
| Real Estate News, U.S. Brokerage Rankings | U.S. brokerages | Sales volume and ranking changes | Journalism and analysis referencing annual rankings | Articles publicly accessible; detailed data may be limited |
| Commercial Property Executive, Top CRE Brokerage Firms | U.S. commercial real estate brokerages | Investment sales and leasing activity | Firm-reported activity | Public ranking coverage |
| Commercial Property Executive, CPE Book of Rankings | Commercial real estate companies, including brokerages | Investment sales and leasing, with multi-year performance | Publication-selected measures and reporting | Public ranking compilation |
Picking the Right Ranking for Your Question
Start with the question, not the headline rank. If you need a measure of the licensed real-estate workforce by geography or employer, use licensing-record-based counts and state the count date and method. A license count is not automatically an active-agent count, and a production list is not a workforce census. When the question concerns active producers, look for a stated transaction threshold and a definition of the period being measured.
For production benchmarking, RealTrends Verified is the clearest fit among these sources because it ranks submitted and verified brokerage production by measures such as transaction sides and sales volume. For broader residential coverage, compare the Mega 1000 and RISMedia Power Broker Report, while keeping their different collection approaches in view: the former offers multiple annual measures, and the latter is survey-based. Use Real Estate News for context on ranking changes and consolidation, not as a substitute for complete underlying rows.
Commercial activity calls for the Commercial Property Executive rankings. Its Top CRE Brokerage Firms and CPE Book of Rankings compare commercial measures such as investment sales and leasing, which shouldn't be mixed with residential agent counts or home-sale production.
Before citing any figure, record the source, reference period, unit, coverage and method. Check whether the ranking counts people, firms, sides, transactions or dollars, and whether acquired brands are grouped with a parent company. ProfessionLens publishes employer pages and ranked lists that readers can inspect and verify, with source and counting-method details to support careful comparisons.
ProfessionLens publishes dated professional counts and brokerage rankings based on public licensing records, organized by profession, geography and employer. Use its employer pages and ranked lists to check how a brokerage headcount is defined before comparing it with production rankings, then visit ProfessionLens to explore the available research.