Home / Blog / 7 Largest Real Estate Brokerages by Agent Count (2026)
7 Largest Real Estate Brokerages by Agent Count (2026)
ProfessionLens, 2026-10-22
The five largest U.S. residential enterprises accounted for about $1.65 trillion of the approximately $2.26 trillion in combined sales volume reported for the 20 largest enterprises, or roughly 73% of that top-20 total, according to the 2025 ranking of the largest real estate enterprises. That concentration doesn't mean the leaders are interchangeable. Anywhere Real Estate led that ranking by agent count, while Compass produced far more sales volume than several firms with larger headcounts, showing that workforce scale and production value measure different things.
This ranking of the largest real estate brokerages puts professional headcount first. It uses ProfessionLens research for the September 2026 reference period and treats franchise networks, affiliated brand portfolios, and centrally operated brokerages as distinct structures. Company-reported transaction sides and sales volume appear only as context, because a licensed agent, an affiliated agent, an active producer, and a brokerage brand aren't the same unit. Read the list as a workforce comparison, not as proof of service quality in any local market.
Table of Contents
- 1. Lists - Largest Real Estate Brokerages
- 2. Compass
- 3. Anywhere Advisors
- 4. eXp Realty
- 5. HomeServices of America
- 6. The Real Brokerage
- 7. Keller Williams Realty
- Largest Real Estate Brokerages: 7-Company Comparison
- How to Read the Brokerage Ranking
1. Lists - Largest Real Estate Brokerages
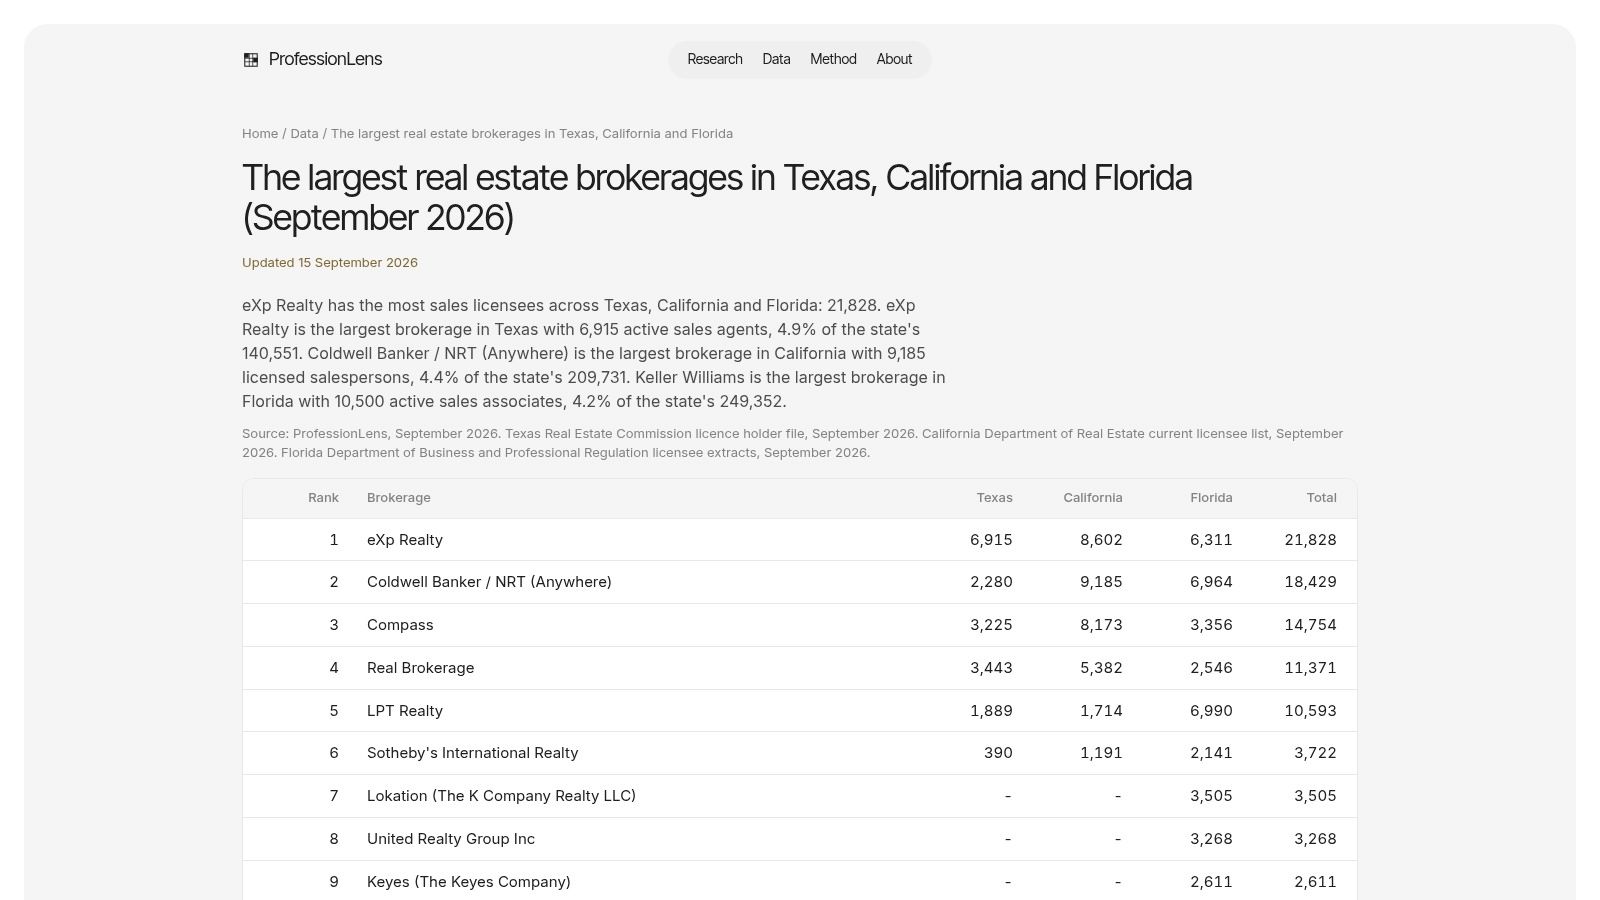
ProfessionLens built its Largest Real Estate Brokerages list for readers who need to compare employer scale without rebuilding the count from fragmented licensing files. The wider site organizes professional counts by profession, geography, and employer, and it documents sources and counting methods across its research. That framing matters here because brokerage is still fragmented nationally. NAR describes more than 10,400 brokerages in its RPR Broker Tool Set network representing over 750,000 agents in its 2025 NAR annual report, so a national top list sits above a very large local tail.
Why This List Works as a Starting Point
You can explore brokerage size in one ranked place, then move into employer pages and related professional-count research instead of treating each company announcement as a standalone claim. For market research, workforce analysis, and recruiting comparisons, that structure is more useful than a sales-volume league table alone. It also forces a better question. Are you comparing affiliated licensees, active agents, or people a firm can deploy in a specific state or metro?
Practical rule: Check the count date, definition, and denominator on the list page before you cite any headcount as an active-agent total.
The limits are clear. The available page preview doesn't show the rankings, figures, or brokerage coverage, so you can't audit a specific row from the preview alone. Headcounts also depend on source date and counting definitions, and they may not equal active agent totals. Use the list to identify scale and structure, then verify local presence separately.
- Pros: Makes comparisons easier in one ranked list, fits a broader employer research resource, documents sources and methods, and supports market and workforce analysis.
- Cons: The preview doesn't display figures or coverage, and headcount definitions may differ from active-agent totals.
2. Compass
Compass is the clearest case for separating headcount from production. It's a large U.S. residential brokerage with a technology-oriented platform and a notable presence in major metropolitan and luxury markets. In the enterprise ranking cited in the opening, Compass stood out for high sales volume relative to its agent count. That pattern suggests price point, market mix, and per-agent productivity do a lot of work that a simple headcount ranking can't explain.
The Compass brokerage profile on ProfessionLens is the place to check its professional headcount on the same basis as other employers. On the client and agent side, Compass offers residential representation through local agents, plus agent-facing tools for listing presentation, marketing, and client management. Those tools sit in categories agents already use heavily. The NAR 2025 Technology Survey found 79% of respondents used electronic signatures, 75% used social media, and 46% used AI-generated content.
Strengths and Limits
- Metropolitan visibility: Compass has a large network and strong presence in many major markets, including higher-priced segments.
- Platform support: Marketing and client-management tools are part of the brokerage offering, not an afterthought.
- Local variation: Service and coverage depend on the office and agent you hire.
- Terms to confirm: Fees and compensation must be checked for the specific transaction, since company size doesn't establish fit.
Don't read Compass's production as a guarantee that a particular listing team is productive. Ask for that team's recent local activity.
3. Anywhere Advisors

Anywhere is best understood as a portfolio, not a single storefront brand. Through Anywhere, the organization is associated with Coldwell Banker, Century 21, Sotheby's International Realty, Corcoran, ERA, and Better Homes and Gardens Real Estate. Those brands serve different segments, including luxury, and they operate through affiliated offices and networks that don't present identically in every market.
That structure is exactly why enterprise totals need a caveat. When a ranking combines company-owned and franchised offices under one corporate umbrella, you're measuring the reach of a brand system, not one centrally employed workforce. For a researcher, Anywhere is useful because it lets you compare distinct brokerage identities inside one enterprise. For a client or recruit, the relevant unit is narrower. It's the brand, office, and agent handling your transaction.
A recognizable national brand tells you who owns or franchises the name. It doesn't tell you how a specific local office staffs, supervises, or supports a deal.
- Pros: Recognizable brands, substantial local-office presence, a portfolio spanning multiple market positions, and high reported enterprise production as noted earlier.
- Cons: Experience differs by brand, office, and agent, and corporate affiliation doesn't mean every office operates the same way.
Confirm the exact local entity on any agreement. That's where accountability sits.
4. eXp Realty
eXp Realty tests a different definition of presence. It's a cloud-based, virtual-first brokerage rather than a traditional office-centered firm, with online collaboration and training resources for agents. A large affiliated network can support referrals between markets, but national reach doesn't automatically mean dense local coverage. You still need to know how many active agents eXp has in the state or metro you're studying.
The eXp Realty employer profile on ProfessionLens helps you make that employer-level comparison on a headcount basis. Separately, eXp's model includes distinct compensation and revenue-share programs. Those programs can attract agents who prefer remote work, but they also require careful review. Program rules, costs, and eligibility don't guarantee income, and headline network size shouldn't substitute for the written terms.
Where the Model Fits and Where It Doesn't
Agents who work well online may value the remote structure and cross-market network. Agents who rely on a physical office, walk-in support, or close local supervision may not. Clients face the same split. The individual agent's local knowledge and availability matter more than the virtual platform behind them.
- Pros: Remote structure, strong reported transaction activity in national rankings, and referral potential across a large network.
- Cons: Less conventional local-office support, market-by-market variation, and compensation programs that need close reading.
5. HomeServices of America
HomeServices of America operates through locally branded brokerage businesses and affiliates rather than pushing one uniform consumer brand everywhere. That gives local companies room to keep market-specific identity and knowledge while sitting inside a broad U.S. network. Related home services may be available alongside brokerage in some markets, but availability varies, so you shouldn't assume a bundled offering in every location.
HomeServices is a good place to apply a productivity check. Headcount alone can't tell you how much business the average affiliated agent closes. NAR reported that the typical U.S. REALTOR® completed only 10 transaction sides and $2.5 million in sales volume in 2024 in its 2025 member trends reporting. Apply that lens to any large network. A firm can look enormous by affiliation while production concentrates in a smaller group of active agents and teams.
What to Verify Locally
- Operating company: Identify the specific local brokerage, since services, systems, and branding differ across the network.
- Service area: Confirm where that office works and which related services it offers there.
- Referral value: Broad reach can help cross-market moves, but only if the receiving office has active local capacity.
For scale comparisons, HomeServices belongs in the top tier. For a hiring or listing decision, the local brand is the decision.
6. The Real Brokerage
The Real Brokerage offers a useful contrast with both franchise systems and traditional office networks. It's a technology-enabled residential brokerage with a digital operating model, a large affiliated-agent network, and agent compensation and equity-related programs. National reach can support referrals, and published production in national rankings lets you place it among higher-volume U.S. organizations. The harder question is whether its tools change outcomes for a specific agent or team.
That caution applies across the industry, and the evidence is mixed. A 2025 survey of more than 100 U.S. residential brokerage leaders found nearly 90% said their agents were using AI, while only 17% of agents in NAR's survey reported a significantly positive business impact from AI and 46% reported no noticeable impact, as summarized in reporting on brokerage AI adoption. Adoption isn't productivity. For Real, as for its peers, ask about hours saved, listing speed, conversion, and error reduction rather than tool counts.
- Pros: Digital tools and flexibility may appeal to agents, national reach supports referrals, and published production allows peer comparison.
- Cons: Program terms and eligibility need written review, experience varies by market and team, and digital-first operations may not suit agents who want in-person support.
Judge the platform by documented local results, not by the label technology-enabled.
7. Keller Williams Realty
Keller Williams should be described as a franchise network, not a single centrally employed brokerage workforce. Its independently operated market centers aggregate into very large national totals. Keller Williams reported 136,511 U.S.-based agents, $370.7 billion in U.S. sales volume, and 796,658 transaction sides in 2025, ranking first among U.S. franchise brands by agent count, sides, and volume for the ninth consecutive year, according to Keller Williams reporting on its franchise ranking. Those totals aggregate participating offices and agents across the network.
You can compare that network on a professional-headcount basis through the Keller Williams profile on ProfessionLens, and explore the consumer and agent offering at Keller Williams. Local offices bring their own leadership and market knowledge, with agent training and business-development resources central to the model. In-person support through a market center may suit agents who don't want a virtual-first firm. Cross-market referral potential is also real, given the footprint.
Analyst note: Don't compare a franchise network's aggregated total directly with a single centrally operated brokerage without saying so. The denominator is built differently.
- Pros: Extensive market-center network, local in-person support, and training as a core part of the model.
- Cons: Service varies by franchise, national size doesn't guarantee a specific office's production, and splits, caps, and recurring costs must be checked locally.
Largest Real Estate Brokerages: 7-Company Comparison
| Item | Organization or Model | Scale Evidence | Key Advantages | Considerations | Best Suited For |
|---|---|---|---|---|---|
| ProfessionLens: Largest Real Estate Brokerages | Research list comparing brokerages by professional headcounts | Preview does not show rankings or figures; counts depend on date and definitions | Consolidates employer-size research and documents sources and methods | Headcounts may not equal active-agent totals; check page notes for coverage and dates | Market research, workforce analysis, and employer comparisons |
| Compass | Large, technology-oriented residential brokerage | $262.23 billion in 2025 sales volume, according to cited 2026 RealTrends results | Broad metropolitan presence, marketing tools, and visibility in luxury markets | Service and terms vary by office and agent; company size alone does not establish individual fit | Buyers and sellers seeking representation in markets served by Compass |
| Anywhere Advisors | Corporate organization with multiple affiliated brokerage brands | $192.76 billion in 2025 sales volume, according to cited RealTrends results | Established brands, broad office network, and coverage across market segments | Local experience and operations vary by brand, office, and agent | Those comparing established brands and local brokerage options |
| eXp Realty | Cloud-based, virtual-first residential brokerage | $155.56 billion in 2025 sales volume and 343,091 transaction sides | Online collaboration, large network, and cross-market referral potential | May not suit those seeking conventional office support; compensation terms require review | Agents who prefer a remote model and clients seeking a large network |
| HomeServices of America | Network of locally branded brokerage businesses and affiliates | $135.91 billion in 2025 sales volume and 212,810 transaction sides | Local brand identities, broad reach, and related services in some markets | Services and systems differ across businesses; local availability should be verified | Those seeking a locally branded brokerage within a broad network |
| The Real Brokerage | Technology-oriented brokerage with a digital operating model | $65.22 billion in 2025 sales volume and 131,047 transaction sides | Digital tools, flexibility, and national referral reach | Program terms and eligibility vary; digital-first support may not suit everyone | Agents seeking a technology-enabled, flexible brokerage model |
| Keller Williams Realty | Franchise network of independently operated market centers | Network-wide production is not combined in the cited RealTrends rankings | Local offices, training resources, and a broad national footprint | Experience, services, and costs vary by market center | Agents seeking local office support and training, or clients comparing local franchises |
How to Read the Brokerage Ranking
Start by naming the metric. Agent count measures workforce scale, transaction sides measure activity, and sales volume measures the dollar value of production. A firm can lead on one and trail on another because of price points, market mix, team structure, or the share of affiliated agents who close business. None of these measures alone establishes agent quality, client service, or expected earnings. If a ranking doesn't tell you which metric produced the order, you can't interpret it responsibly.
Next, check how the count was built. Look for the ProfessionLens count date, the source behind each employer figure, and the method notes on rows read, retained, and dropped. Ask whether the figure covers licensed, active, affiliated, or employed agents, because those categories produce materially different totals. The same caution applies to structure. A franchise network, a portfolio of affiliated brands, a virtual brokerage, and a centrally operated firm may all appear in one table, but they don't employ or supervise agents in the same way.
Turning Scale Into a Decision
For research, use the ranking to map market structure, then add productivity and geography. Separate licensed headcount from active producers, compare sides and volume per agent where you can, and check agent density by state or metro instead of treating national coverage as local presence. A brokerage with nominal representation in a market isn't equivalent to one with a staffed office and active local teams.
For hiring, recruiting, or choosing representation, go one level down. Compare the relevant local office, its recent market performance, the compensation plan in writing, and the support structure you will receive. Ask who supervises the work, what tools are required or provided, and what the recurring costs are. National scale can create referral opportunities and training resources, but your outcome will be decided locally. The largest real estate brokerages are a starting point for that inquiry, not the answer to it.
ProfessionLens counts licensed real estate agents and other professionals by employer, profession, and geography, with dated sources and documented counting methods you can cite and inspect. Use its brokerage rankings and employer profiles to compare headcount on a consistent basis before you assess local production, compensation, and support. Visit ProfessionLens to explore the brokerage list and related workforce research.