Home / Blog / Physician Assistant Statistics 2026: Counts and Trends
Physician Assistant Statistics 2026: Counts and Trends
ProfessionLens, 2026-11-12
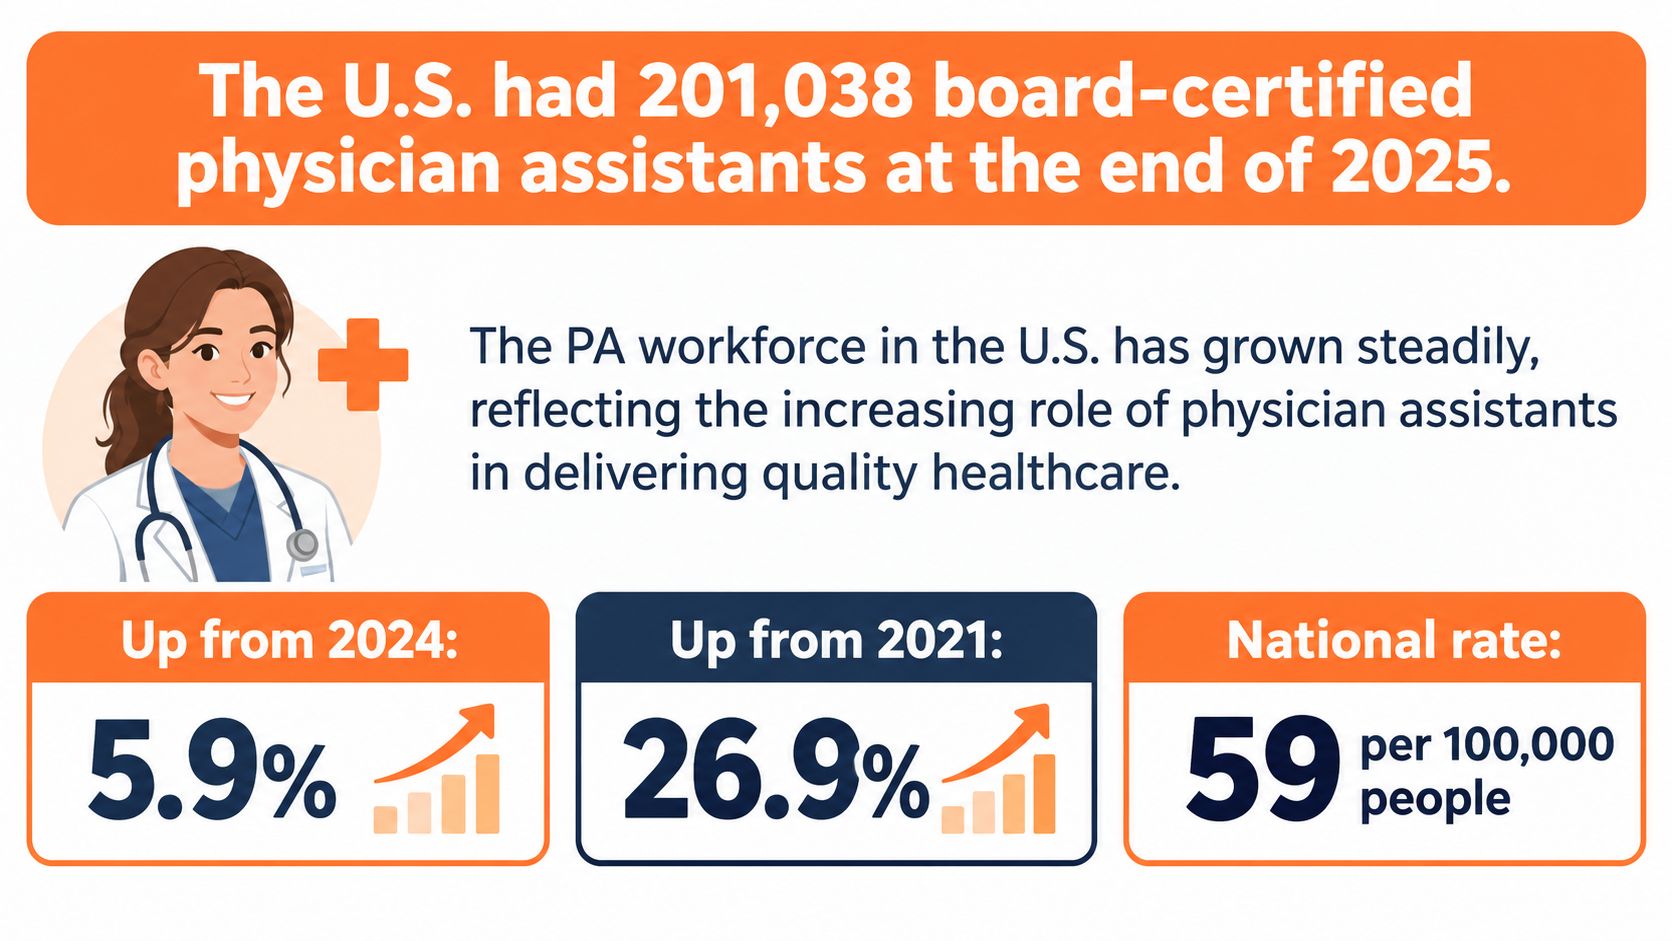
The United States had 201,038 board-certified physician assistants at the end of 2025, a national rate of 59 per 100,000 people. That's a certified count; employment and active-supply figures are lower because they measure different populations.
For researchers, recruiters and policy analysts, the important question isn't how many PAs exist. It's which population belongs in the analysis, whether those professionals provide clinical care, and where patients can reach them. National workforce growth and local access are different outcomes, and physician assistant statistics need to distinguish them.
Table of Contents
- How Many PAs Are in the United States
- Which PA Count Answers Your Question
- Active PAs by Specialty
- Practice Settings and Telehealth Use
- Urban, Rural and Metropolitan PA Distribution
- Growth Outlook and Density Trends
- Confirm Figures Against Primary Sources
How Many PAs Are in the United States
The headline answer is a board-certified population, not a count of available clinicians. A certification total establishes the size of the credentialed profession. It doesn't establish how many PAs an employer can recruit, how much clinical capacity they provide, or how that capacity is distributed.
Headline PA counts by measure and date
| Measure | Count | Reference date | Source |
|---|---|---|---|
| Board-certified PAs | 189,907 | 31 December 2024 | NCCPA |
| Board-certified PAs | 201,038 | End of 2025 | NCCPA 2025 statistical profile |
| Board-certified density | 59 per 100,000 residents | 2025 | NCCPA 2025 statistical profile |
| Active PAs, federal model | 168,514 | 2023 | Federal workforce model |
| PA jobs, employment | 168,900 | 2025 | BLS Occupational Outlook Handbook |
| Projected PA jobs | 204,600 | 2035 projection | BLS projection |
The table preserves each figure's population and reference period. Its rows aren't competing estimates of the same thing, and subtracting one from another wouldn't produce a defensible count of nonworking PAs.
Separate the population from survey respondents
NCCPA recorded 189,907 board-certified PAs as of December 31, 2024, while 159,514 supplied at least part of the statistical profile, an 84.0% response rate; the accompanying employment benchmark is the BLS Occupational Outlook Handbook, which reports 168,900 PA jobs in 2025.
The distinction between the certification roster and profile respondents matters. The roster supports the certified total. Survey responses support descriptions of respondents' work, characteristics and practice patterns, subject to the population and response base for each question.
An overall response rate doesn't mean every profile item has the same denominator. Before reusing a specialty or setting percentage, inspect whether it describes all certified PAs, responding PAs, clinically practicing respondents or a narrower cohort.
Practical rule: Record the measure, reference date, geography and source beside every PA number you reuse.
That small amount of metadata prevents a headline total from becoming an unsupported claim about patient-care capacity. It also makes later updates possible without changing what the series measures.
Which PA Count Answers Your Question
A single PA total can conceal several populations: board-certified professionals, active clinicians, full-time-equivalent clinical supply and employed workers. Choose the population before choosing the number.
Certification answers a credential question. Active supply answers a clinical-workforce question. Full-time equivalents translate working time into capacity, while employment statistics describe jobs. Geographic measures add another distinction: where professionals practice relative to residents and need.
PA counting terms and where each applies
| Term | What it counts | Typical use |
|---|---|---|
| Board-certified PA | Practitioners holding current NCCPA certification | Certified capacity and growth series |
| Active PA | Modeled clinical supply after adjusting for retirees, overseas and nonclinical roles | Supply and adequacy analysis |
| PA FTE | Full-time-equivalent capacity, with 40 hours a week as one FTE | Capacity planning |
| BLS PA jobs | Employment reported by the Bureau of Labor Statistics | Employment and setting comparisons |
| Density | Board-certified PAs per 100,000 residents | Comparing states or years |
| Rural and urban classification | Location of practice as urban, large rural, small rural or isolated | Geographic access analysis |
| Health Professional Shortage Area | Federally designated area short of primary care providers | Access and shortage planning |
The federal workforce model estimates 168,514 active PAs in 2023, after adjustments for retirement, work abroad and nonclinical roles, while BLS projects 204,600 PA jobs by 2035, according to the workforce figures associated with the BLS physician assistant occupational profile.
The model also reports an average working week of 41.54 hours, against a 40-hour FTE benchmark, and total FTE supply approximately 7% above active headcount. Treat the FTE estimate as a model output, not as a conversion factor to reconstruct from the average workweek alone.
Match the measure to the decision
- Hiring and adequacy planning: Start with active supply or FTE. Then narrow the analysis to the specialty, service area and work schedules relevant to the vacancy.
- Professional growth: Use a consistent certification series. Don't switch to employment midway through the trend because a newer release is available.
- Employer and sector analysis: Use employment by setting, while preserving the statistical agency's employer categories.
- Licence-based comparisons: Record the file's pull date and exclusion rules. A licence record isn't, by itself, evidence of current patient care in that jurisdiction.
For broader comparisons, the same discipline applies to licensed healthcare professionals. Our counts are computed from public licensing rolls and federal files as pulled on the count date, and a roll can carry errors, duplicates or lapsed licences.
Adequacy is a model result, not a vacancy rate
The federal model's 2023 supply adequacy estimate was 99.2%, corresponding to a shortfall of slightly more than 1,400 FTE PAs. Those are capacity estimates under the model's assumptions, not a count of advertised vacancies or a guarantee that patients can obtain appointments.
For a staffing decision, inspect how the model defines supply, demand and FTE before interpreting adequacy. A national result can't tell a rural clinic whether an appropriately trained clinician is available locally.
Never add certified and active totals together. They overlap rather than describe separate pools of professionals.
The other common mistake is attaching a density to the wrong population base. A rate calculated from certified professionals must remain labelled as certified density, even when the analysis concerns clinical access.
Active PAs by Specialty
Active PAs by specialty group, 2023
| Specialty group | Active PAs, 2023 |
|---|---|
| Primary care | 39,374 |
| Medical specialties | 26,938 |
| Surgical specialties | 43,226 |
| Hospital medicine | 6,052 |
| Other specialties | 52,924 |
| All active PAs | 168,514 |
These federal workforce-model categories describe active clinical supply, not the certification population. They partition the model's active workforce; they aren't additional professionals to add to a certified total.
The largest category is other specialties. That label is useful for reconciling the national model but too broad for a specialty-specific recruitment strategy. An analyst assessing a particular service line needs a more detailed classification before translating that category into potential hires.
Primary care requires its own denominator
The primary-care group provides a more relevant starting point for primary-care access analysis than the entire PA profession. Counting every PA as potential primary-care supply would disregard the clinicians working in surgical, medical and other specialty roles.
Even a correctly defined primary-care headcount leaves important questions unanswered. For local planning, establish whether the clinician maintains a patient panel, accepts new patients, provides continuing care or works primarily in episodic services.
Specialty and setting are separate dimensions. A hospital is a workplace, not a specialty definition. Don't infer primary-care responsibility from an employer category or assume that every office-based PA provides primary care.
For a narrower career or recruitment question, American Cardiology Group's cardiology PA job outlook for 2026 offers a specialty-focused resource. Use it to frame cardiology-specific questions, not as a substitute for a national workforce denominator.
Compare composition before scale
Say a health system wants to compare its PA workforce with a regional benchmark. First, map its internal specialty labels to the benchmark's categories. Otherwise, differences in coding can look like differences in staffing.
Then compare specialty shares, followed by headcounts and working time. A system with a substantial surgical service will need a different mix from an ambulatory primary-care network.
- Check category boundaries: Establish where the source places overlapping or mixed clinical roles.
- Keep the population consistent: Compare active clinicians with active clinicians, rather than mixing active supply and certification.
- Inspect working time: A specialty headcount alone doesn't establish appointment capacity or coverage.
The analytical objective isn't to reproduce the national mix everywhere. It's to identify whether local staffing matches local services and patient needs.
Practice Settings and Telehealth Use
Practice setting of recently board-certified PAs, 2024
Half of newly certified PAs enter hospital practice. The NCCPA statistical profile of recently board-certified PAs puts 50.6% of the 2024 cohort in hospitals, up 5.4 percentage points from 2020, while office-based private practice drew 29.3%, down 4.5 points.
| Practice setting | Share of recently certified PAs, 2024 | Change since 2020 |
|---|---|---|
| Hospitals | 50.6% | +5.4 percentage points |
| Office-based private practice | 29.3% | -4.5 percentage points |
Community health centers (4.6%) and urgent care (4.3%) each held smaller shares of the cohort. The profile offers no 2020 comparison for either setting, so only the two rows above support a trend reading.
These figures describe recently board-certified PAs, not the entire profession. They answer pipeline questions, such as where new entrants are landing, rather than mapping where all PAs practice.
A rising hospital share also doesn't mean the same individuals left office practice. Different cohorts choose different settings, and survey populations shift between editions. Read the change as a shift in cohort composition unless longitudinal data show individual movement.
Telehealth describes a different population
The telehealth figures use a different denominator. Across the broader board-certified PA population, NCCPA reports 43.5% provided telehealth in 2024, up from 20.7% in 2020. Applying that rate to the recently certified table would mix populations: participation among established clinicians says nothing directly about how many hospital-based newcomers deliver virtual care.
Telehealth participation measures adoption, not volume. A clinician who reports virtual care may devote one session a month or several days a week to it, and the rate alone cannot distinguish those patterns.
For operational planning, record virtual-care hours, services delivered and the patients reached. AONMeetings' secure virtual consultation guidelines can help teams turn a general telehealth capability into an explicit consultation workflow.
- Hospital systems: Assess the recent-certification pipeline against inpatient and acute-care recruitment needs.
- Ambulatory employers: Plan recruitment around a private-practice pipeline that still takes 29.3% of the cohort even after its decline.
- Regional planners: Record telehealth capability as a workforce attribute, then establish whether those services reach the populations being assessed.
The useful planning distinction is between where a PA works and how that PA delivers care. Keep both fields in workforce files rather than folding virtual care into a separate, mutually exclusive workplace category.
Urban, Rural and Metropolitan PA Distribution
PA distribution by area type, 2025
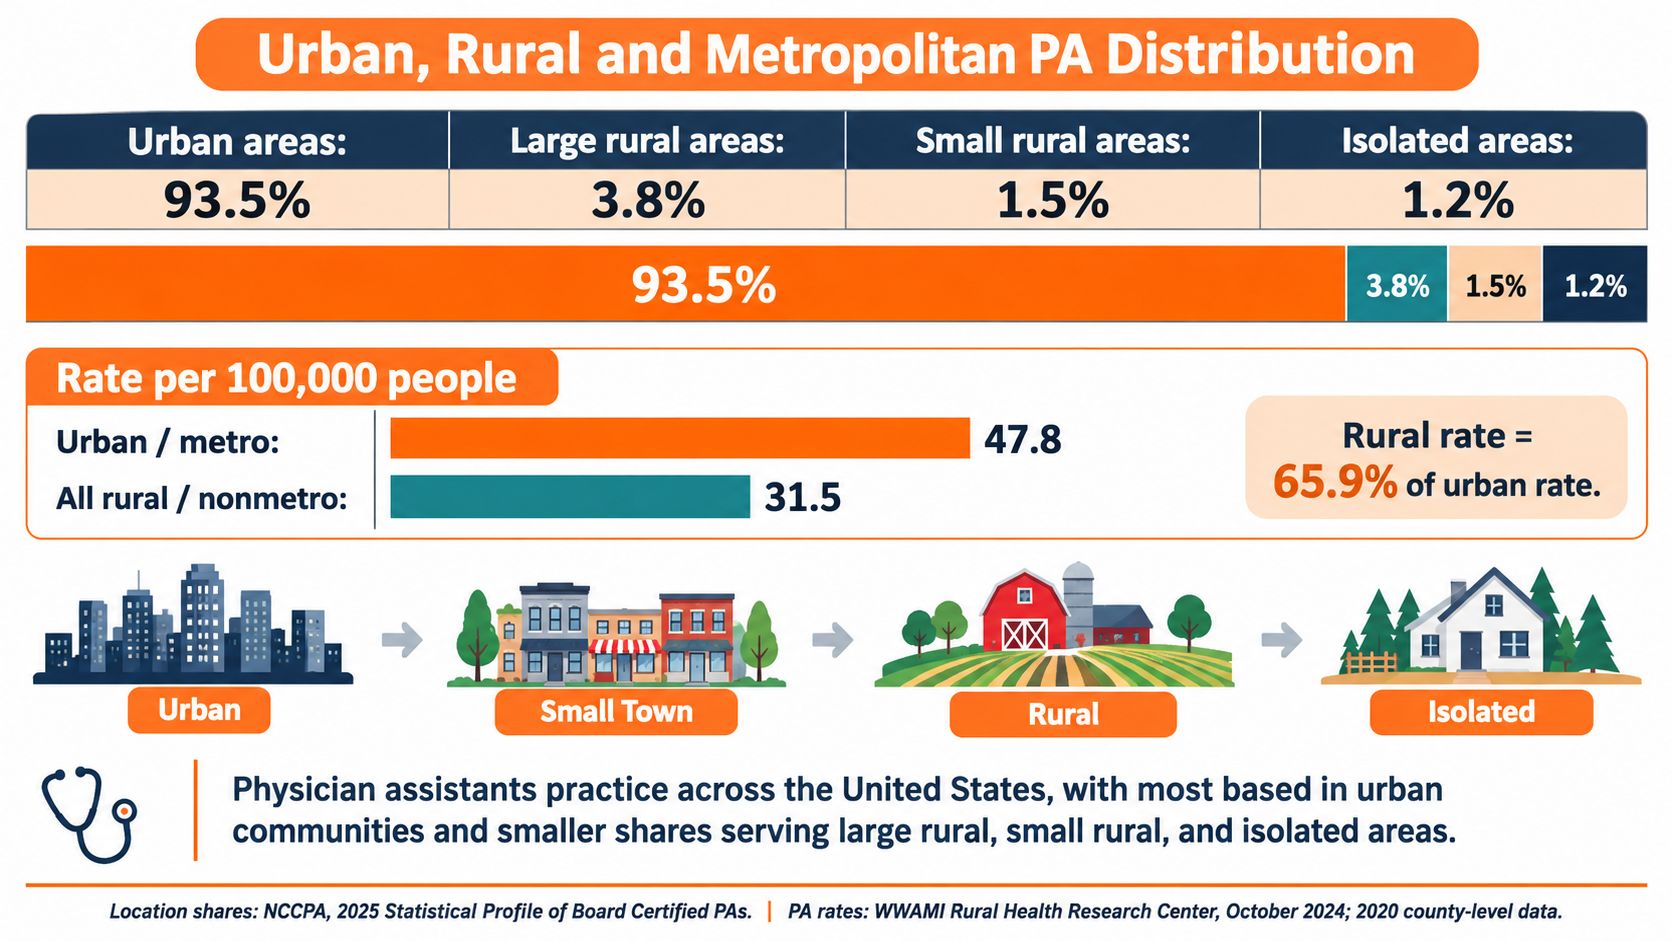
The NCCPA 2025 statistical profile reports 93.5% of PAs practicing in urban areas, compared with 3.8% in large rural areas, 1.5% in small rural areas and 1.2% in isolated areas.
| Area type | Share of PAs, 2025 | PAs per 100,000 residents |
|---|---|---|
| Urban areas, all | 93.5% | Not separately reported |
| Large rural areas | 3.8% | Not separately reported |
| Small rural areas | 1.5% | Not separately reported |
| Isolated areas | 1.2% | Not separately reported |
The profile also places the national certified count at 201,038 at the end of 2025, up 5.9% from 2024 and 26.9% from 2021, with 59 board-certified PAs per 100,000 people. Those national gains don't establish that growth reached underserved communities.
Geographic precision exposes evidence gaps
The profile reports shares by area type but doesn't publish per-capita rates for each category, so analysts cannot derive rural and urban densities from this source alone. Treat any secondary rural-versus-metropolitan rate as a different measure until its population definition is confirmed.
A rural share describes where PAs are located. A rural density describes how many PAs serve the rural population. Because rural areas hold a small fraction of the workforce and a larger fraction of the land and population they cover, the two figures can diverge sharply. A 3.8% workforce share in large rural areas tells a different story than whatever per-capita rate those residents experience.
Likewise, urban and metropolitan classifications shouldn't be substituted for one another without careful consideration. The table leaves unavailable cells unfilled rather than inventing equivalences between classification systems.
Interest isn't deployed capacity
The profile reports that 44% of PAs were practicing in or interested in practicing rurally, while 63.1% of primary-care Health Professional Shortage Areas were rural. Interest and existing rural practice are combined in the former measure; it cannot be interpreted as the share currently delivering rural care.
The access question is whether PAs are available relative to need and serve as primary-care access points, not simply whether the profession is growing.
Build county comparisons using population, rurality, shortage-area status and patient-panel responsibility. Statewide averages can conceal county-level scarcity, so work at the smallest geography the count supports. For comparisons with nurse practitioners by state, align practice status and geography before comparing clinician totals.
Broader comparisons require state-level certification data or licence rolls paired with population from the same reference period. Check whether every geographic percentage divides by residents or by PAs, and retain the count date.
Growth Outlook and Density Trends
Density is more informative than headcount when comparing workforce availability across differently sized populations. It expresses the clinician count relative to residents, rather than treating a large state's larger workforce as evidence of better access.
Headcount growth and density growth answer different questions. The former describes expansion of the professional population; the latter describes how that expansion compares with changes in the resident population.
Read the numerator and denominator together
A density increase can result from more PAs, fewer residents or workforce growth that exceeds population growth. Analysts should inspect both components rather than attributing the entire change to successful recruitment or training expansion.
The same principle applies when comparing PAs with physicians per capita by state. Matching the population denominator is necessary, but it isn't sufficient if the clinician numerators describe different registration or practice statuses.
A credible trend dataset should retain:
- Source and population definition: Identify certification, employment, licensure or modeled clinical supply.
- Population base: Record the resident estimate and its reference period.
- Geographic assignment: Specify whether location reflects practice, employment or another recorded address.
- Comparability notes: Flag changes in classifications, exclusions or survey cohorts.
Expansion doesn't establish improved access
The employment projection indicates continued national expansion, not a forecast that every specialty and county will gain proportionately. Workforce planners shouldn't distribute projected national growth across local areas without a geographic model.
Similarly, a recent increase in the certified population doesn't reveal whether employers filled hard-to-recruit posts. That requires evidence about local deployment, clinical responsibilities and service availability.
Trend test: A credible line states the source, certification or practice base, population base and reference year for every point.
Track local density alongside headcount, then examine whether the added workforce serves the intended patients. That approach distinguishes professional expansion from an improvement in access without assuming that either one guarantees the other.
Confirm Figures Against Primary Sources
Before publishing physician assistant statistics, create a source log that another analyst could use to reproduce the result. Keep the original files or report tables, not just a copied headline.
A verification routine for reusable figures
Start with NCCPA for certification. Retrieve the latest statistical profile and record its reference date. Separate the certification roster from survey respondents, and check the denominator beneath each specialty, setting or demographic table.
Use BLS for employment and projections. Confirm the employment reference year, projection period and employer categories. Keep projected employment explicitly labelled as a projection rather than presenting it as a current workforce count.
Inspect state licensing records directly. Record the download date, licence status filters and geographic field used. Establish how duplicate records and multiple licences are handled before describing the result as a count of people.
Match geography with population. Use an appropriate state or county population file and retain its reference period. Check whether the published measure is clinicians per resident, residents per clinician or a share of the professional workforce.
Align populations across professions. Compare like with like. Label federal active-supply results as modeled estimates, and don't compare a provider-registration total with a clinical-employment total as though they use identical inclusion rules.
Preserve the provenance of combined files
Our licensing counts draw on the NPPES provider file, the CMS Doctors and Clinicians file, state licence rolls from Texas, Illinois, Washington, Florida and California, and BLS OEWS. Those sources answer different questions, so their names and count dates belong with the resulting figures.
Keep separate fields for source release date, file pull date and workforce reference period. A newly downloaded file doesn't automatically describe newly measured employment, and a publication year doesn't necessarily identify the year clinicians were counted.
For each reusable figure, retain the table title, population definition, exclusions and calculation. If you derive a rate, preserve its numerator and denominator so another reader can inspect the arithmetic.
If a number can't be traced to its measure, reference date and source, leave it out. An omitted figure is preferable to a precise-looking claim that cannot support the decision attached to it.
Visit ProfessionLens for professional workforce counts organized by profession, geography and employer, with named sources and count dates. Use those reference pages and documented research to build PA comparisons that distinguish licensing records, clinical supply and local workforce distribution.