Home / Blog / Nurse Practitioners by State: Counts, Rates and Gaps
Nurse Practitioners by State: Counts, Rates and Gaps
ProfessionLens, 2026-11-02
Participating nurses cared for approximately 2.4 million patients across the Nurse Corps program in 2024, according to the HRSA Nurse Corps field strength infographic. That figure doesn't count every nurse practitioner in America. It counts a specific federally supported workforce, and that distinction changes every conclusion you can draw from it.
That's the problem with most rankings of nurse practitioners by state. They present one number as if licensed, active, practising and federally placed clinicians were the same population. They're not. A state can lead on registry records, trail on active primary care, and look well supplied statewide while its rural counties remain short.
Table of Contents
- Which Count Measure Fits Your Question
- Compare State Counts and Rates
- How to Calculate NPs per 100,000 Residents
- National Nurse Practitioner Count and Growth
- Practice Authority Rules That Change Capacity
- Rural and Shortage Gaps Behind State Totals
- Questions About Citing and Updating State Counts
- Pre-Publication Checks for State Rankings
Which Count Measure Fits Your Question
Rank every state by raw NP count and you get one order. Rank them by clinicians serving shortage areas and the order can nearly reverse. Both rankings can be accurate. They are counting different populations, so the first step is naming yours.
Provider registry records show who is on file under a national provider identifier. They confirm a registration, not that the clinician is practising, practising in that state, or practising full time. ProfessionLens licensing counts come from the NPPES provider file, the CMS Doctors and Clinicians file, state licence rolls from Texas, Illinois, Washington, Florida and California, and BLS OEWS, and each count is labeled with the file that produced it rather than blended across sources.
Four Measures, Four Different Populations
| Measure | What it counts | Source | Example value |
|---|---|---|---|
| Provider registry record | Clinicians with an NPI record, not confirmed as practising | NPPES | 530,577 (15 September 2026) |
| Active primary-care NPs | Modelled estimate of those in primary-care practice | HRSA workforce projections | 83,638 nationally (2023) |
| Federal program NPs | Clinicians serving approved NHSC sites | National Health Service Corps | Placed clinicians only, not all licensed NPs in a state |
| State licence records | Licensed NPs on the state board file | State licensing authority | A separate measure, pulled board by board in the state table below |
The gap between the first two rows is the point. HRSA reports an estimated 83,638 active primary-care nurse practitioners nationally in 2023, and HRSA's workforce projections page explains that its Health Workforce Simulation Model estimates supply and demand rather than counting licenses. A modelled output carries its own geography, year and scenario variables, so it cannot share a column with an administrative record.
Federal program counts are narrower still. A National Health Service Corps state value covers clinicians serving approved sites, which makes it useful for questions about shortage-area service and misleading for questions about total supply. State licence rolls sit between the two measures: they confirm licensure in that state, a tighter population than a registry record but broader than clinicians in active practice.
Practical rule: Use licensed supply for registration questions, active primary care for access questions, and program counts only for questions about federal service.
Put the measure in the table header, not in a footnote. If a reader cannot tell from the header whether you counted licenses, active clinicians or full-time equivalents, they will compare your number against a different measure and conclude one of you is wrong. Usually both numbers are right. They are just not the same number, and which one you publish decides whether your ranking answers a supply question or an access question.
Compare State Counts and Rates
A state table becomes comparable only when every row shares the same measure, denominator and reference month. The national ceiling is clear: NPPES counted 530,577 nurse practitioners on 15 September 2026. That total cannot show which states leave residents farthest from care, because identical counts can describe very different levels of supply once population is applied.
Minimum Fields for a Comparable State Table
| Field | Publishable entry | Comparability risk if it differs |
|---|---|---|
| State | One row per state plus the District of Columbia | Rows drop out of the same ordering |
| NP count | Count from one named file, with duplicates removed | Licensed, active and program counts get mixed |
| Resident population | Same-year population estimate for every row | Rates measure calendar drift instead of supply |
| Rate | Count divided by population, multiplied by 100,000 | Ranking field becomes unstable |
| Source and count date | Source named in the row, common reference month in the header | A newer file looks like growth |
Two columns deserve attention before the count itself.
- Count date: Every ranked row needs the same reference month in the table header, so a fast-growing state is not rewarded for having a newer file.
- Rate per 100,000: This is the ranking field, and it stays comparable only when the population year matches the count year.
Rank the Rate, Not the Total
Raw totals mostly measure population size. A large state will usually post a bigger count than a small one, even when its residents have fewer practitioners available to them. Take two states reporting similar totals while one has twice the population. The raw ranking treats them as level. The rate moves the smaller state ahead, and the rate is closer to what a resident experiences.
That inversion is why sort order matters more than the headline number. Order by total and the table ranks states by size. Order by NPs per 100,000 residents and it ranks density of supply, which is the question most readers think they are asking. The same logic drives our physicians per capita by state comparison, where population size would otherwise dominate the ordering.
The sharper reversal appears when rural access enters the frame. A state can sit high on raw NP count because one metro area holds a large employed workforce, then fall once the comparison asks how supply is spread across rural counties. A lower-count state with fewer large hubs can rise on that second ordering even though its headline total never changed. Separate the questions: total count describes scale, rate describes density, and rural measures describe reach.
Rows that cannot share the same source family and count date should stay out of the ranked output rather than sit at the bottom. Bottom placement reads like a finding. Exclusion marks a gap in comparability, which is the accurate result. Once the fields above are fixed, the table can carry a real ordering instead of a precise-looking artefact.
How to Calculate NPs per 100,000 Residents
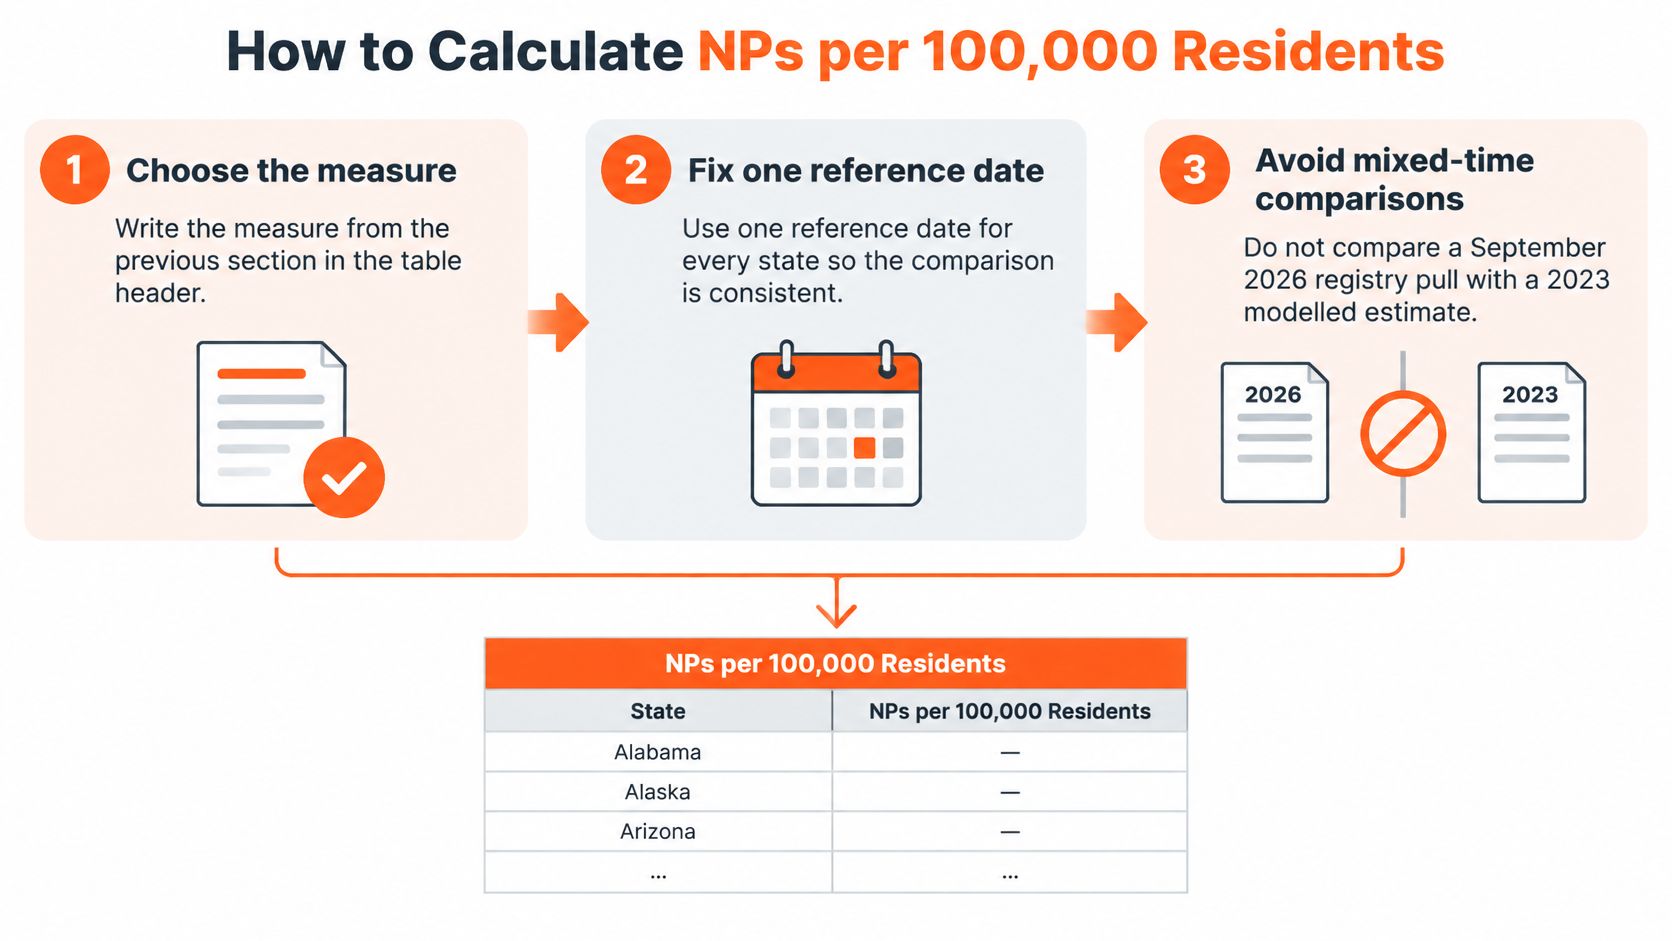
The arithmetic is simple. The errors come from the inputs, so most of the method is about controlling what goes into the division.
Eight Steps From File to Rate
- Choose the measure. Write it in the table header before you pull any data. Deciding afterward invites you to keep whichever file gives the cleanest ranking.
- Fix one reference date. Apply it to every state. Don't compare a September 2026 registry pull with a 2023 modelled estimate, because you'd be measuring elapsed time as much as supply.
- Take the state count from one file type. Use the state licensing file or NPPES state records, then remove duplicate records. For an active-supply measure, also drop records that aren't linked to practice.
- Get resident population for the same year. Use federal population estimates matched to your reference date. The common slip is dividing an adult-only clinician count concept by a total population without noting the mismatch.
- Divide and scale. Divide the count by population, then multiply by 100,000. As an illustrative example, not state data, 4,000 NPs in a state of 2,000,000 residents gives 200 per 100,000.
- Check the base before publishing shares. Publish a percentage share only when the underlying base has at least 20 rows. Below that, one record moves the share enough to mislead.
- Round and label. Round the rate to one decimal place, which is honest precision for administrative files. Label any modelled value separately so it never sits unmarked beside a license count.
- Record the audit trail. Note the source, count date, and rows read, retained and dropped. Without those three numbers, nobody can reproduce your rate, including you in six months.
Where Calculations Usually Go Wrong
Mixing dates is the most frequent fault, and it's invisible in a finished table. Two states can appear 15 points apart purely because one's file is newer. Deduplication failures run second. A clinician licensed in two states, or holding records under a maiden and married name, inflates both counts unless you match on a stable identifier.
A rate is only as comparable as its least consistent input.
Close with the national check. Add your state rows, calculate a national rate, and compare it with the national benchmark for the same measure. If your national figure doesn't reconcile, your state rows are wrong somewhere, and it's better to find that out before publication than from a reader. Reconciliation won't tell you which state is off, but it tells you whether to keep looking.
National Nurse Practitioner Count and Growth
HRSA reported 280,140 nurse practitioners in 2024, up 35.5% from 2020, in the HRSA State of the Health Workforce Report 2024. That's the baseline your state numbers sit against.
National Nurse Practitioner Count, 2020 to 2024
| Year | NP count (HRSA) | Change from prior year |
|---|---|---|
| 2020 | 206,800 | Baseline year |
| 2021 | 221,890 | +15,090 |
| 2022 | 234,690 | +12,800 |
| 2023 | 258,230 | +23,540 |
| 2024 | 280,140 | +21,910 |
The four-year gain was 73,340 practitioners. Growth wasn't even. The annual increase roughly doubled after 2022, with +23,540 in 2023 and +21,910 in 2024, compared with gains of around 13,000 to 15,000 in the two earlier years.
That acceleration matters for state interpretation. If you're comparing a state file from 2022 with one from 2024, part of any difference is national growth, not state performance. A state whose count rose across that period may have just moved with the country.
These are national workforce totals, not state licence counts, so they set a benchmark rather than a state figure. They can't be apportioned to states by population share, because supply doesn't distribute evenly.
Set beside them a second, different measure. The count of nurse practitioners in the US is 530,577 on NPPES, dated 15 September 2026. That total is nearly double the HRSA workforce figure, and the difference isn't growth. One counts registry records, the other estimates the workforce. You can't subtract one from the other to derive inactive clinicians, and you can't chain them into a trend.
For the fuller national series and related measures, see our nurse practitioner statistics research. Use the national trend for one job. It tells you whether a state is growing with the country or against it, which is a different claim from whether the state has enough practitioners.
Practice Authority Rules That Change Capacity
Two states with identical NP rates can deliver very different amounts of care. The difference is what state law allows each practitioner to do without another clinician's involvement.
The American Association of Nurse Practitioners classifies state practice environments according to whether state law permits NPs to evaluate patients, diagnose, order and interpret diagnostic tests, initiate and manage treatment, and prescribe medications and controlled substances under the state board of nursing's authority, as set out in the AANP state practice environment classification. In reduced-practice or restricted-practice states, at least one element is limited or a career-long regulated collaborative agreement with another health professional is required.
Why Headcount Overstates Capacity in Restricted States
Say a state has a high NP rate but requires a collaborative agreement for prescribing. Every one of those practitioners depends on another clinician's availability to complete routine care. A smaller state with full practice authority doesn't carry that bottleneck, so its practitioners can open panels, staff rural clinics and manage treatment without waiting on a co-signature.
That means a density ranking assumes equal legal capacity per practitioner. Where authority differs, the assumption fails, and the ranking flatters restricted states.
- Add a categorical practice-authority field: Place it beside each state count, not in a separate appendix readers won't join back.
- Cite the state regulation: A classification without its regulatory source can't be checked or updated.
- Carry an as-of date: Laws and classifications change, so an undated authority field ages into an error.
If you're adding one field to an existing state table, add practice authority first. It costs one column and it stops readers treating headcount as service capacity.
Rural and Shortage Gaps Behind State Totals
Metropolitan areas have 69.5 NPs per 100,000 people, compared with 55.2 per 100,000 in non-core counties, according to the HRSA State of the Primary Care Workforce 2025 report. A statewide rate averages those two realities into a figure that describes neither.
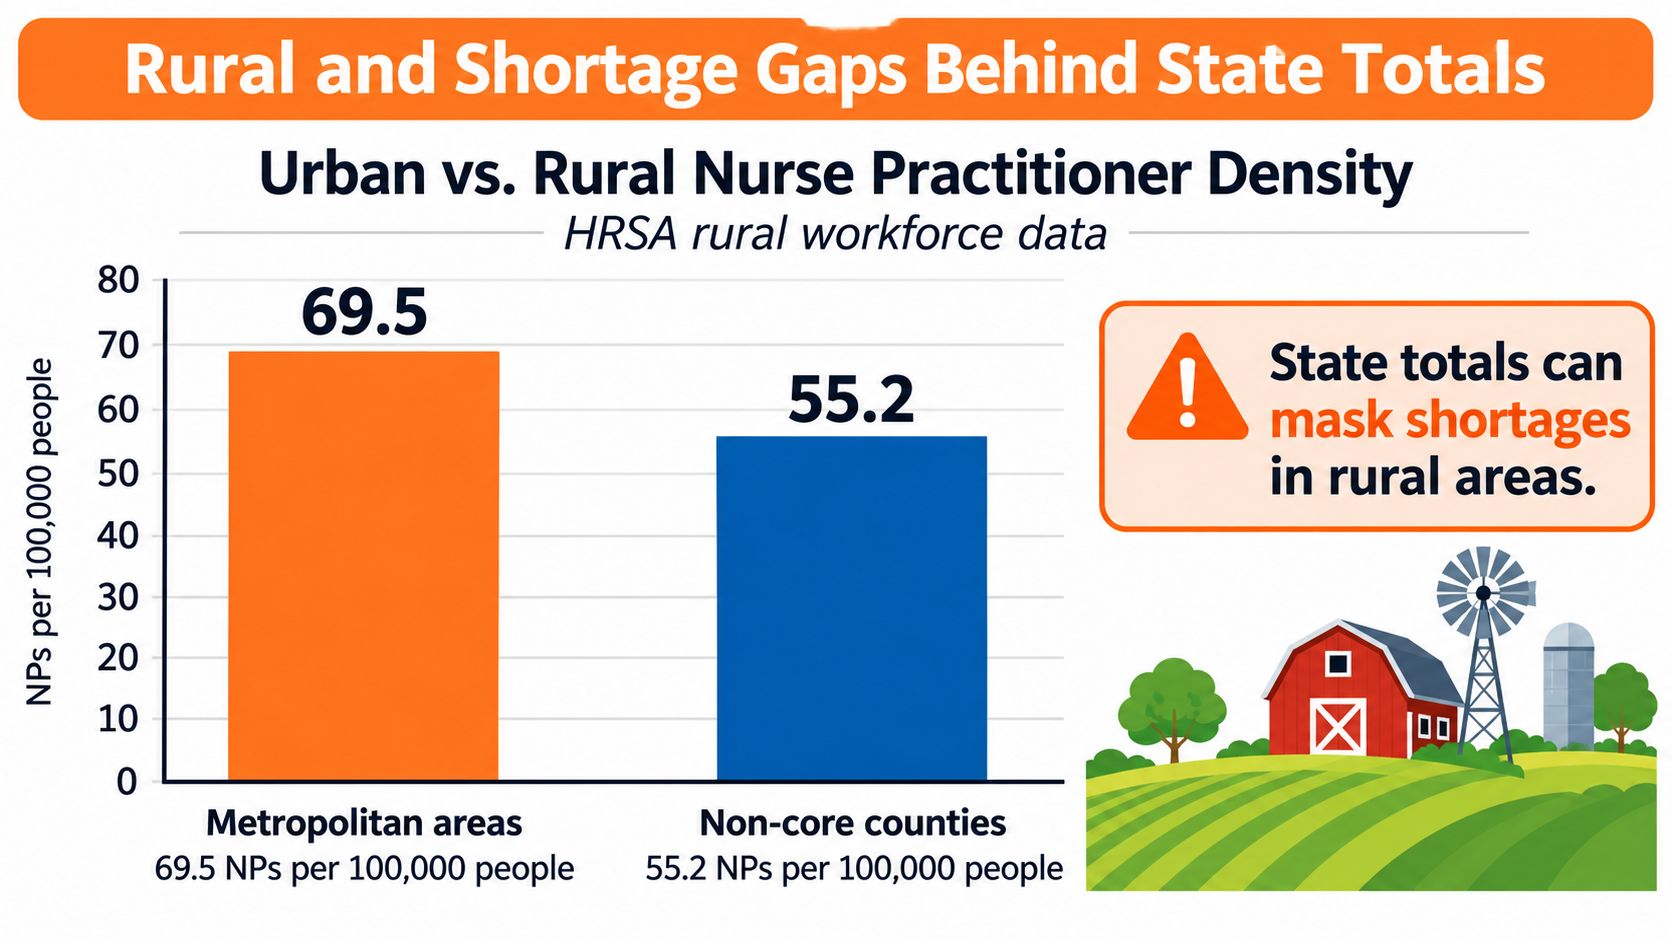
HRSA projections model 83,638 active primary-care NPs in 2023. That is an estimate of the active primary-care subset, a different measure from licensed headcount, and it belongs on the page labelled as modelled. Beside it sit the need figures: HRSA records 8,466 primary-care Health Professional Shortage Areas affecting approximately 92 million U.S. residents as of December 2025, with 63.1% of those designated areas rural. A large workforce and widespread shortage coexist because the workforce is unevenly distributed. A state total averages that distribution away.
Three Checks Before You Call a State Well Supplied
- Rural-to-metro ratio: Compare non-core and metropolitan rates within the state. A wide gap means the statewide rate is carried by its cities.
- Shortage-area overlap: Map practitioner locations against Health Professional Shortage Areas to see whether supply sits where need is designated.
- Primary-care share: A state heavy in specialty practice can post a strong overall rate while routine access stays thin.
Federal placement programs exist because market distribution leaves these gaps. The National Health Service Corps staffs approved sites across all 50 states, the District of Columbia, Puerto Rico, the U.S. Virgin Islands and the Pacific Basin. Small rural states can depend heavily on that targeted service while posting modest absolute totals, so a raw ranking understates both their need and the federal support meeting it.
Denominator choice changes the order too. Our comparison of nurse practitioners per 100 physicians by state puts Mississippi at 86 and Hawaii at 25, a spread no raw NP count reveals. Rank states by headcount and rank them by rural access and the two lists can run in opposite directions. Check county distribution before calling a state well supplied, because patients do not look for care at the state line.
Questions About Citing and Updating State Counts
Why do two totals for the same state differ? Because they measure different populations, and both can be correct. Check the measure, the source file and the count date before assuming an error. If those three differ, you don't have a discrepancy. You have two answers to two questions.
How current is a count? Only as current as its reference date, which every count should carry. Treat a state row without a date as unverified, however authoritative the page looks. Undated figures can't be compared and shouldn't be cited.
Can I cite a count? Yes, if you cite the named source and its date alongside the number. Keep the method notes recording rows read, retained and dropped, so the figure can be traced back to the file it came from. ProfessionLens count pages carry no individual names, only counts by profession, state, county and employer, which keeps citation at the aggregate level.
How do I update a comparison? Pull a newer file, recalculate the rate using the same method, and record the new date beside the old one. Don't overwrite the earlier value. Keeping both dates is what turns a static table into a trend your readers can audit.
Pre-Publication Checks for State Rankings
Run these six checks before any ranking of nurse practitioners by state goes live.
- Same reference month: Confirm all 51 entries use one month and the header names the count measure.
- No estimated cells: Each value is verified from a dated file or marked unverified, and unverified rows aren't ranked.
- Sort on the rate: Order by NPs per 100,000 residents, not raw count.
- Authority field present: Practice authority and its as-of date sit beside every state.
- National reconciliation: If the national row doesn't match the benchmark, the state rows are wrong.
- Traceable sources: Every value carries its source and date.
We publish 17 count pages, each counting a licensed profession nationally or in one state, by state, county or employer, with state-level counts for Texas, California, Florida, Illinois and Washington. Your single next step is to pull the licensing file for the state you plan to rank, dated to the same month as the rest of your table, and check it before citing any number.
Visit ProfessionLens to compare nurse practitioner counts by state alongside physicians, dentists and pharmacists, with the source and count date shown on every page. Our count and research pages separate licensed, active and registry-based measures so you can cite the number that fits your question. Start with the state you're analysing, check its rate per 100,000 residents, and download the underlying rows where you need to verify the ranking yourself.