Home / Blog / Real Estate Agents by State: 2026 Counts and Sources
Real Estate Agents by State: 2026 Counts and Sources
ProfessionLens, 2026-11-08
The typical REALTOR® reported 10 transactions in 2024, according to NAR's member income summary. That's a productivity measure for association members, not a count of everyone holding a real estate license. It reframes the question behind real estate agents by state: are you measuring credentials, permission to practice, employment, or actual business activity?
A useful state comparison starts by naming the record being counted. Without that label, an apparently precise total can combine salespersons, brokers, inactive credentials, and duplicate records while answering none of those questions reliably.
Table of Contents
- Agent Counts for Key States, With Dates
- Licensed, Active and Working Agents Are Different Counts
- License Status and Renewal Gaps Within a State
- How to Pull a State's Agent Count From Its Regulator
- Comparing States Fairly by Population and Geography
- National Benchmarks From BLS and NAR
- Turning Agent Counts Into Transaction Estimates
- Confirm the Count and Date Before You Cite It
Agent Counts for Key States, With Dates
Texas is the only state in this comparison with a dated count ready to report: 140,551 active sales agents, according to the Texas Real Estate Commission's count dated 15 September 2026. The other state rows identify the records that a count would need to cover, rather than presenting unsupported figures.
Licensed and Active Agent Counts by State
| State | Record counted | Count and source date |
|---|---|---|
| California | Individual real estate licensees, including agents and brokers | No count reported |
| California | Licensees affiliated with a broker | No count reported |
| Texas | Active sales agents | 140,551, Texas Real Estate Commission, 15 September 2026 |
| Florida | Real estate sales licensees | No count reported |
| Illinois | Individual real estate licensees, separated by license category | No count reported |
| Washington | Individual real estate licensees, separated by license category | No count reported |
The California rows distinguish all individual licensees from those with a broker affiliation. Those records answer different questions and should not be combined as if they measured the same population.
The Texas figure counts active sales agents on its stated date. It does not count brokers, measure recent transactions, or establish how many agents work full time. Matching the record definition to the question is necessary before comparing state totals.
Licensed, Active and Working Agents Are Different Counts
Start with the question you need to answer, then choose the counting unit. Licenses issued measure entry during a period. Currently active licenses describe a credential status at a point in time. Neither automatically establishes recent sales activity.
The National Association of REALTORS® licensing guidance identifies state commissions as the licensing authorities and distinguishes REALTOR® membership from licensing. Requirements and status definitions differ by jurisdiction, so a familiar label shouldn't be treated as a national legal classification.
Match the Unit to the Question
| Your question | Appropriate starting measure | What still needs checking |
|---|---|---|
| Who entered the licensed population? | Licenses issued during the reporting period | Whether renewals, transfers, or reinstatements are included |
| Who holds a currently active credential? | Active license records | The regulator's meaning of active |
| Who meets the relevant affiliation condition? | Active records with the required broker relationship | Whether the relationship is current and applicable to that license class |
| How many people are represented? | Deduplicated individuals | Multiple credentials and identifier quality |
| How many people work in the occupation? | Employment estimates | Occupational scope and employment methodology |
Unique individuals deserve particular attention. A file organized around credentials may contain more than one record for the same person. Summing rows can therefore answer how many credentials exist without answering how many people hold them.
Affiliation also needs careful interpretation. A salesperson's relationship to a supervising broker is not necessarily the same kind of relationship recorded for a broker. Don't apply a salesperson eligibility rule indiscriminately to every credential category.
Keep the Definition Beside the Number
Retain the regulator, extraction date, status filter, and deduplication rule with each published count. Add the license classes included and the geography used for assignment, such as mailing address or licensed office location.
A useful definition is specific enough for another analyst to reproduce. “Active individual salesperson records, excluding expired credentials and deduplicated by regulator person identifier” is more informative than “agents.”
The deeper analytical point is that permission, participation, and production are separate dimensions. A licensing file can establish the first only within its regulatory definitions. Employment and transaction evidence are needed to investigate the others.
License Status and Renewal Gaps Within a State
A license record can remain in a regulator's system without representing a currently practicing agent. Status fields are therefore part of the count's meaning, not administrative detail to discard after downloading the file.
California illustrates why license classes also need separate treatment. The California Department of Real Estate's July 2025 licensing statistics reported a 70% renewal rate for salespersons, compared with 93% for brokers. Those rates describe renewal behavior by license class, not the share of all licensees actively selling property.
That distinction prevents an easy analytical mistake. A renewal rate measures what happened to the eligible renewal population; it doesn't directly measure the current workforce, annual transaction participation, or the probability that a newly licensed person will remain in business.
Read Status Codes Before Counting Records
- Active: Check what the regulator permits under that status and whether additional conditions apply.
- Inactive: Determine whether the credential remains valid administratively while practice is suspended.
- Expired: Keep these records out of a current-authorization count unless the regulator's rules establish otherwise.
- No broker affiliation: Inspect the license class and applicable affiliation requirement rather than treating the label as a universal employment status.
- Restricted: Read the restriction field before deciding whether the record belongs in your target population.
Our Florida first-renewal retention analysis provides a separate lens on persistence after licensing. A cohort-based retention question should stay separate from a point-in-time headcount because the denominator and observation period differ.
A valid credential, a renewed credential, and a recently productive agent are not interchangeable observations.
Make the Inclusion Decision Explicit
First, confirm the status filter against the regulator's documentation. Next, decide whether inactive credentials belong in the population you're studying. Finally, report renewal retention separately when a suitable renewal series exists.
For recruitment research, inactive licensees might be a relevant audience. For a current-practice estimate, including them could be inappropriate. Neither choice is wrong, but an unexplained choice makes the resulting total difficult to use.
How to Pull a State's Agent Count From Its Regulator
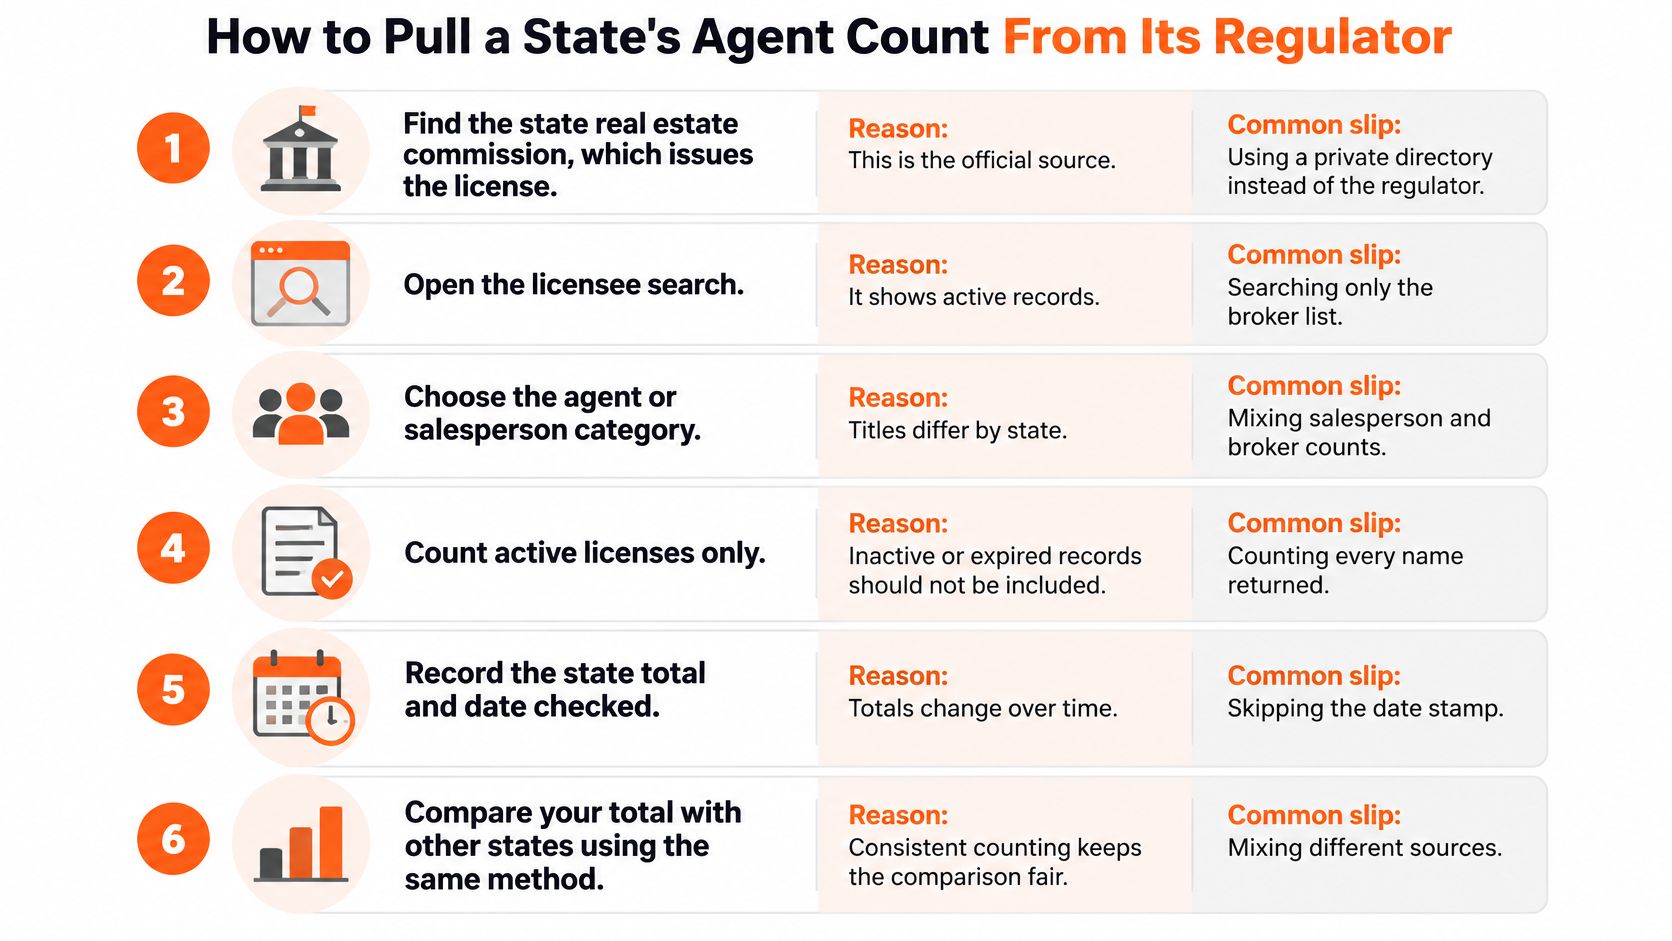
A reproducible count needs a saved input file, explicit filters, and a record of what was removed. A search-result total alone is difficult to audit because another researcher may encounter changed records, different default filters, or a different search scope.
Build a Reproducible Extraction
Find the licensing authority. Locate the state commission or department responsible for the credential, then identify its downloadable roster or official search system. The common slip is substituting a private directory or association membership list for the licensing population.
Save the file and its dates. Preserve the original download, the extraction date, and any regulator reporting date. Don't assume the date you downloaded a file is the date its records were updated.
Filter license classes and statuses. Inspect the distinct values before choosing which records to retain. Counting every returned row can combine people, firms, expired credentials, and unrelated license categories.
Deduplicate at the right level. Prefer a stable regulator person identifier when available. Don't merge people solely because their names match, and don't assume different license numbers necessarily identify different people.
Calculate distinct outputs. Retain separate results for total records, active records, relevant broker-affiliated records, and unique individuals. Keep a reconciliation showing exclusions so a reviewer can follow the transition from input rows to the final population.
Publish the definition with the result. Name the regulator, reference date, included classes, status conditions, and deduplication rule. The common failure is publishing a number that can't be rebuilt from its accompanying citation.
Check the Output Without Forcing Agreement
Within the same file and scope, the active subset shouldn't exceed the total, and a filtered affiliation subset shouldn't exceed its parent population. Those checks only work when the populations are nested; independently licensed brokers may require separate treatment.
Our source system draws on state license rolls and BLS OEWS, alongside NPPES and CMS files for other professions. Those healthcare files aren't substitutes for real estate licensing records.
If you're automating collection or joining property information, Scrappey's real estate API roundup is a starting point for evaluating tools. Assess access permissions, field definitions, update practices, and coverage before using an API output in a licensing count.
Comparing States Fairly by Population and Geography
A raw total answers how large the recorded population is. A population-adjusted rate answers how common that recorded population is relative to residents. Neither tells you, by itself, whether agents are oversupplied or whether consumers have adequate local access.
The numerator must be settled before normalization. Dividing a mixed active-and-inactive license total by population doesn't turn it into an active-workforce measure. It produces a resident-adjusted rate for the same mixed population.
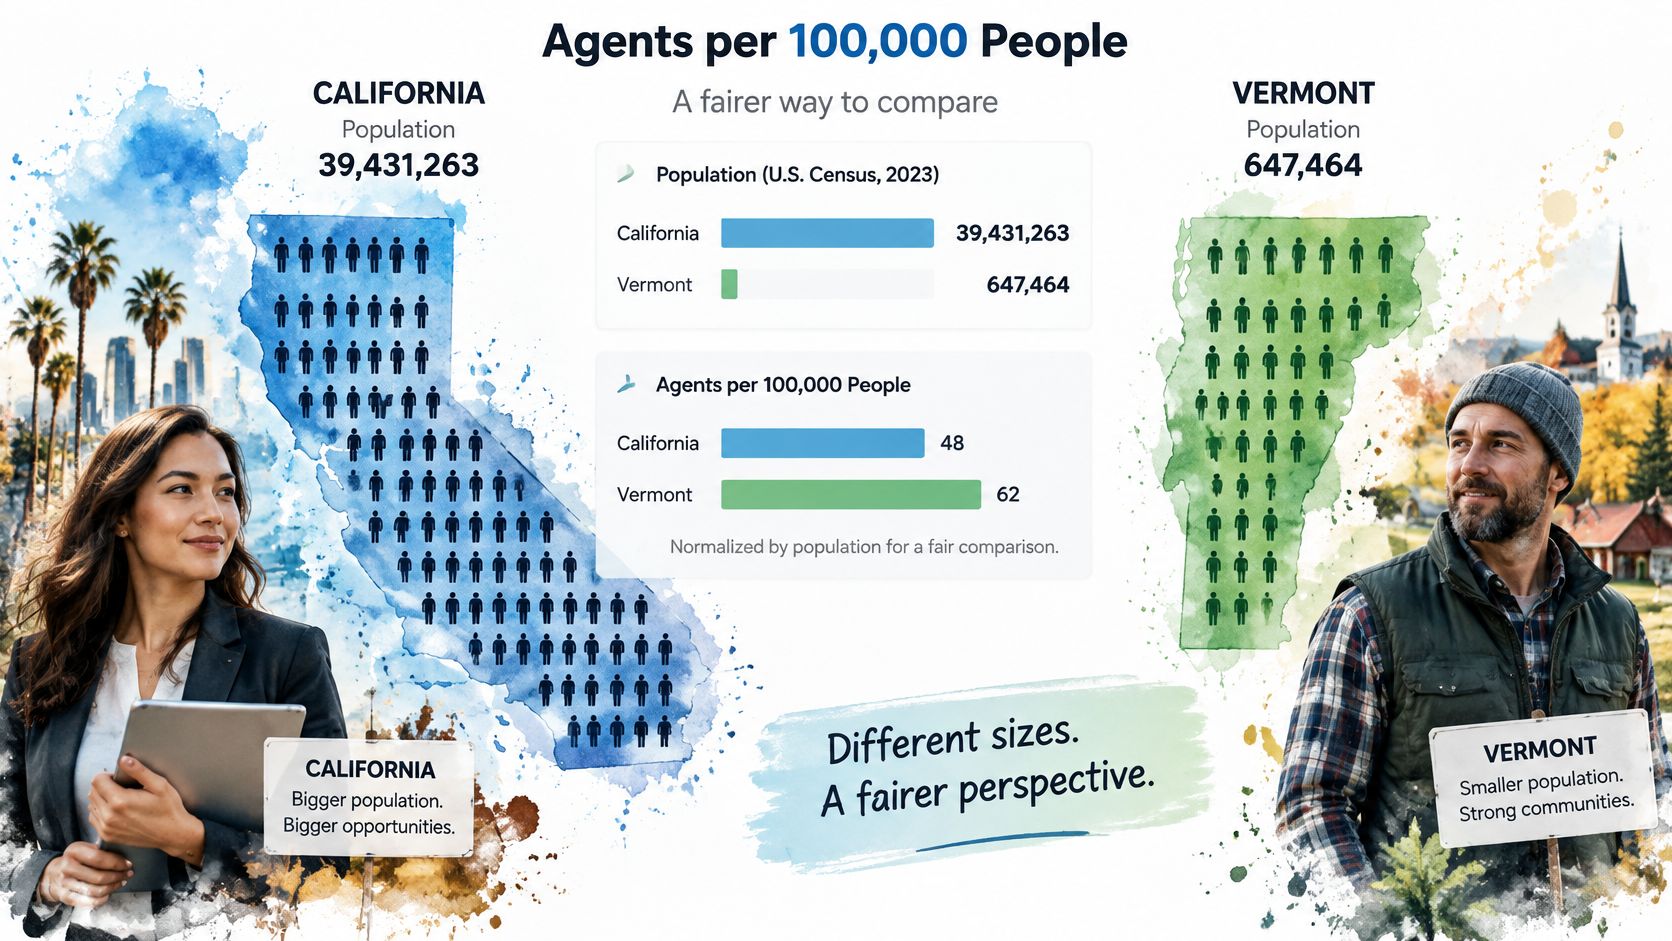
Treat an illustrative chart as a presentation format, not independent evidence. Any plotted California or Vermont rate needs a traceable numerator, population denominator, and calculation before it can support a published ranking.
Normalize Only After Defining the Numerator
The calculation is straightforward:
Agent rate = selected agent count ÷ resident population × reporting scale.
Choose a reporting scale, label it clearly, and apply it consistently. Our population denominators use US Census Bureau state population estimates dated 1 July 2024. The date matters because a later licensing snapshot paired with an earlier population estimate is a mixed-period measure, even if the arithmetic is correct.
For California, the appropriate comparison would calculate separate rates for verified licensed individuals and verified active practitioners under the applicable affiliation rules. A numerical worked result isn't warranted until those numerators and the population value have been established.
Test Whether the Comparison Is Fair
- Match dates: Avoid interpreting differences between snapshots as differences between states.
- Match populations: Don't compare all valid credentials in one state with active salespersons in another.
- Match geographic assignment: A licensee's mailing address, office address, and authorized practice territory aren't necessarily equivalent.
- Inspect local distribution: A statewide average can't establish whether practitioners are accessible in a particular rural county or metropolitan market.
Comparison test: If switching the numerator changes the story, publish both definitions rather than selecting the more dramatic ranking.
Resident-based rates also omit the volume and composition of property transactions. Use them to describe professional density, then examine local activity and service geography before drawing conclusions about competition or capacity.
National Benchmarks From BLS and NAR
The national employment benchmark is narrower than a national license count. The BLS industry employment chart reports approximately 153,740 real estate sales agents employed in the real estate industry in May 2024. The industry restriction is essential: this isn't a census of everyone holding a state credential.
A different BLS series reports jobs for the broader occupational population. These measures should be treated as separate benchmarks, not successive observations in a single growth series.
National Benchmarks for Agents and Brokers
| Measure | Figure | Period | Source |
|---|---|---|---|
| Sales agents employed in the real estate industry | Approximately 153,740 | May 2024 | BLS industry employment estimate |
| Real estate sales-agent jobs | Approximately 427,000 | 2025 | BLS Occupational Outlook Handbook |
| Real estate broker jobs | Approximately 103,500 | 2025 | BLS Occupational Outlook Handbook |
| Combined agent and broker jobs | Reported as 530,600 | 2025 | BLS Occupational Outlook Handbook |
| Projected combined jobs | 538,800 | 2035 projection | BLS Occupational Outlook Handbook |
| Median annual wage, sales agents | $56,320 | May 2024 | BLS, cited by NAR |
| Median annual wage, brokers | $72,280 | May 2024 | BLS, cited by NAR |
| Typical REALTOR® transactions | 10 | 2024 | NAR member survey |
| Median REALTOR® gross income | $58,100 | 2024 | NAR member survey |
The BLS Occupational Outlook Handbook supplies the occupational job counts and projects combined employment to reach 538,800 by 2035, approximately 2% growth. Its separately rounded agent and broker figures shouldn't be used to manufacture a more precise combined total.
The wage and member-survey rows use NAR's income summary cited at the opening. Median wages and member gross income aren't interchangeable earnings measures, and neither should be assigned to every state license record.
Use the Benchmark That Matches the Decision
For workforce geography, BLS offers a standardized occupational framework across states, metropolitan areas, and nonmetropolitan areas. For credential administration, regulator files remain the appropriate starting point. For business productivity, a member survey describes its surveyed population rather than the entire licensed population.
Employer analysis introduces another denominator. Our largest real estate brokerages comparison addresses organizational scale, which shouldn't be confused with a state's total licensed population.
A brokerage's headcount also needs an attribution rule. Office affiliation, brand membership, and unique licensed individuals can produce different organizational totals, especially when a researcher combines records across jurisdictions.
Turning Agent Counts Into Transaction Estimates
An agent count can be multiplied by a productivity benchmark to build a transaction scenario. The result depends on the population chosen and the assumption that its members share the benchmark's activity. Exact arithmetic does not establish that a population matches a survey's participation pattern, workload, or transaction mix.
Transaction Capacity Stress Test by Count Base
| Count base | Agents and illustrative transaction scenario | Caveat |
|---|---|---|
| Texas active sales agents | 140,551 agents. At 10 transactions per agent, the scenario is 1,405,510 transactions. | Active licenses only; the productivity benchmark describes NAR members. |
| California under a broker | Not calculated without a verified affiliation count. | License class and affiliation rules must be resolved before multiplication. |
| BLS employed sales agents, May 2024 | Approximately 153,740 employed agents. At 10 transactions per agent, the scenario is about 1,537,400 transactions. | Employment isn't a license count; applying member productivity assumes comparability that hasn't been established. |
The Texas scenario applies the typical-member benchmark to the active sales-agent count. It is not a Texas transaction forecast or observed sales total, and it does not mean each active licensee completes that workload. The BLS scenario uses an employment count, so its denominator differs from a state licensing count.
Specify What a Transaction Means
An estimate should distinguish transaction sides, agent participations, and unique property sales. If agents on both sides of a sale receive credit, adding their activity does not necessarily count distinct properties sold.
The distribution of activity also matters. Multiplying a population by median activity generally does not yield the population's aggregate activity. A total estimate needs observed production or a suitable mean, with coverage and nonparticipation addressed explicitly.
ProfessionLens's analysis of agent headcount and housing-sales capacity examines the broader capacity question. A state-level estimate still depends on a consistent population definition and a clear transaction measure.
A sensitivity analysis can separate practitioners with observed activity from those without it, then compare alternative production assumptions. Keep broker involvement explicit rather than assigning identical selling activity to supervisory and transaction-focused roles without evidence.
Use the scenario to compare assumptions, not individual earning potential. License records alone do not establish how business is distributed among agents, how much revenue they retain, or whether the market can support additional entrants.
Confirm the Count and Date Before You Cite It
A publishable state count needs a clear identity: what was counted, when it was counted, which authority supplied the records, and which statuses were retained. Preserve the underlying file and extraction logic so the result remains checkable after the regulator updates its system.
Keep employment estimates, membership measures, and license totals in separate rows. A clean presentation doesn't require every row to use the same source; it requires every comparison to use compatible definitions.
Decision rule: For current authorization, apply the state's active-status and applicable affiliation requirements. For actual participation or market capacity, add employment or transaction evidence and label estimates accordingly.
Our Florida real estate agents full list contains 307,516 people and 307,516 rows and costs $29 as a one-time purchase per list. That product description isn't, by itself, a substitute for documenting the regulator date and status basis of a workforce claim.
Before publishing your next comparison, rebuild the state row from the official file, save the download, and record both the source's reference date and your extraction date. Cite the definition alongside the result, not in a footnote readers must guess applies.
ProfessionLens publishes professional counts by geography and employer, with documented sources and count dates. Visit ProfessionLens to review state-level real estate counts and use the available downloadable lists where you need record-level analysis rather than a headline total.