Home / Blog / Insurance Brokerage Rankings: 7 Sources That Actually Count
Insurance Brokerage Rankings: 7 Sources That Actually Count
ProfessionLens, 2026-11-09
Searchers often treat insurance brokerage rankings as interchangeable. They measure different things: revenue tables compare financial scale, surveys record client votes, and licensed-producer counts measure workforce size. A firm can rank highly by consolidated revenue without leading in insurance-only revenue or producer headcount.
Name the comparison criterion before citing a rank. The seven sources below use different measures, so each ranking should be read with its stated scope in mind. When matching firm names to legal-entity records, business data integration with SOSfinder can help distinguish a trade name from a licensed entity.
Table of Contents
- 1. Insurance Agent Database
- 2. Business Insurance U.S. Brokerage Revenue Rankings
- 3. Insurance Journal Top 100 Independent P/C Agencies
- 4. AM Best Top 20 Global Insurance Brokers
- 5. Insurance Business 5-Star Brokerages
- 6. Insurance Business Top Insurance Brokers and Agents
- 7. Insurance Journal Top Agency Partnerships
- 7 Insurance Brokerage Rankings Compared
- Match the Measure to the Question, Then Cite It
1. Insurance Agent Database
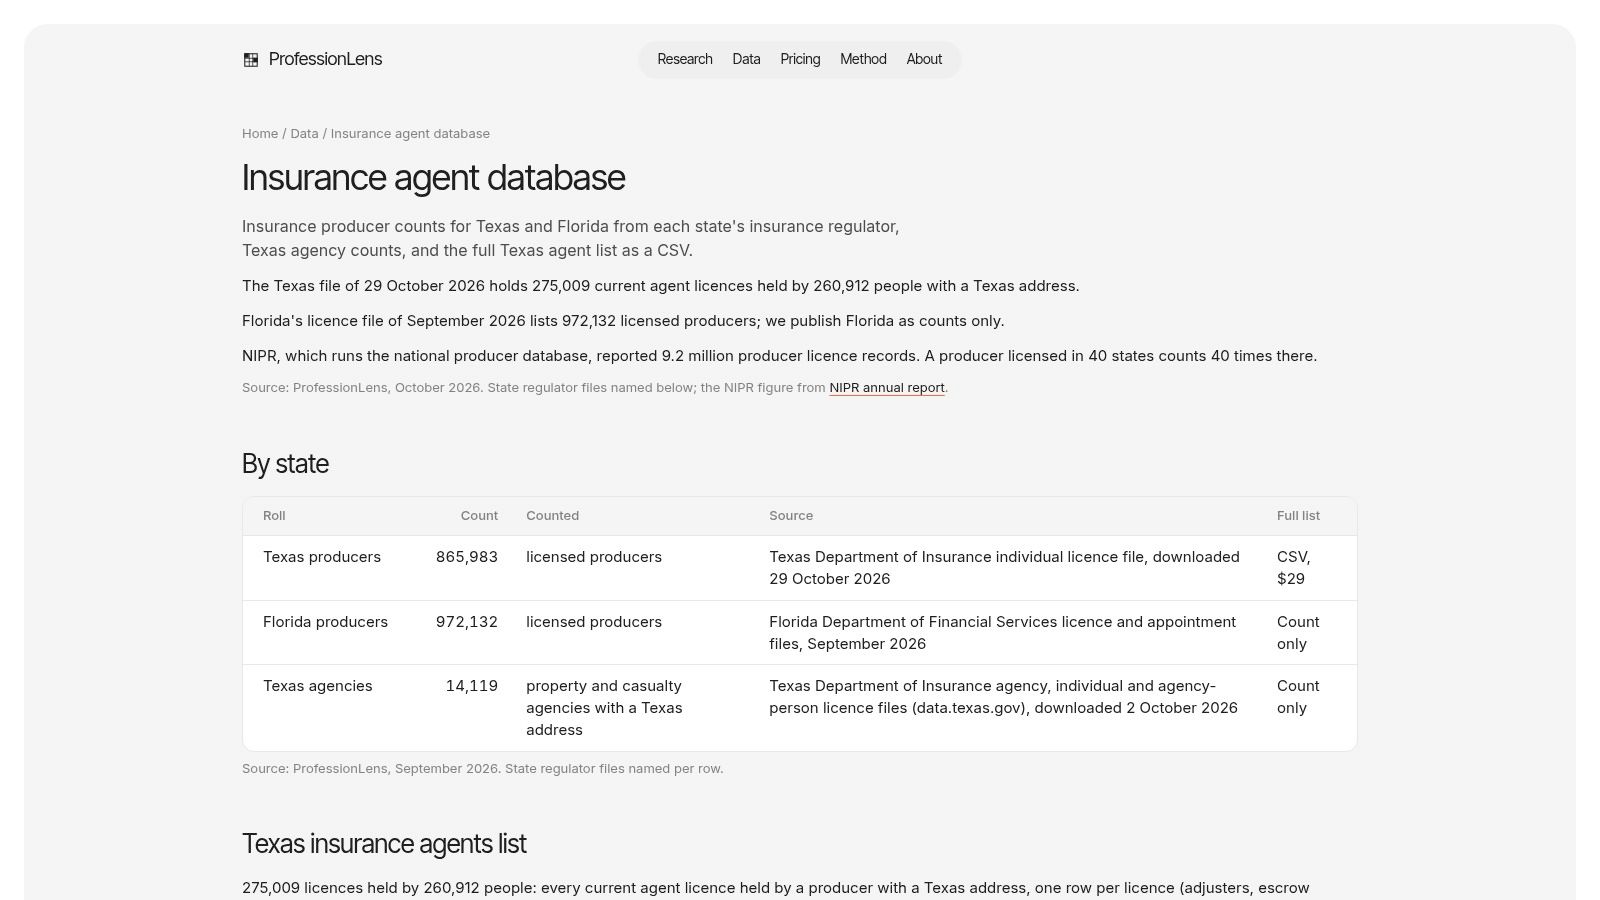
Revenue lists tell you how much a firm books. They do not tell you how many people are licensed to sell. The Insurance Agent Database is built for that second question. We organize U.S. insurance producer figures from public licensing records by profession, geography, and, where the source supports it, employer. Pages publish aggregate counts, not a directory of names and phone numbers.
Licence rolls instead of estimates
The method is a full-file count, not a sample and not a voluntary submission. Each count page names its source and count date. We separate licensed, active, and appointed producers, because those three labels are not interchangeable and mixing them inflates a market. Shares are published only when the underlying base has at least 20 rows. Selected full datasets are sold as one-time CSV files for analysts who need the rows behind a citation. Teams that speed up insurance lead intake still need a headcount baseline before they decide which state is dense with producers.
What it is good for:
- Workforce scale: Compare producer populations across states without treating firm revenue as a proxy for people.
- Citation: Documented sources and counting rules are easier to defend than an unsourced market estimate.
- Employer context: The same research set includes professional and employer counts, so a brokerage headcount can sit next to other licensed professions.
- Further analysis: CSV downloads support your own cuts once the public page is too aggregated.
What it does not do: It will not hand you individual agents' contact details, and the page preview does not spell out every field, coverage edge, or download term. It is also not a quality score. A large appointed base can coexist with weak client service.
Practical rule: If the sentence you want to write is about people licensed or appointed, do not borrow a revenue rank to stand in for that count.
2. Business Insurance U.S. Brokerage Revenue Rankings
Say you need the largest U.S. brokers by what they earn from brokerage, not by how many offices they list and not by how clients rate them. Business Insurance publishes a directory that ranks the Top 100 on year-end U.S. brokerage revenue. The 2026 edition also profiles the world's 10 largest brokers and adds revenue by business line, acquisitions, and company officers. PDF and Excel editions are the working formats.
That measure is the right one when the question is domestic brokerage scale. Prior-year context shows whether a firm climbed because brokerage revenue grew or because the list around it changed. Business-line splits matter when benefits revenue and property-casualty revenue would otherwise be added into one number and treated as the same business.

The detailed directory is a paid product. A rank here still says nothing about service quality or licensed-producer headcount. Two firms with similar U.S. brokerage revenue can have very different producer benches, and this list will not show that gap. Quote it as a revenue ordering of brokerage scale, and stop there.
3. Insurance Journal Top 100 Independent P/C Agencies
This list is narrower than a global broker table, and that narrowness is the point. Insurance Journal's Top 100 ranks U.S. retail independent property-and-casualty agencies by total P/C agency revenue. The 2026 edition, which Insurance Journal describes as its 22nd, is free online and uses information reported for the preceding year. Entries can show P/C revenue, other revenue where available, office locations, and certain ownership types.
It is built for comparing independent and regional agencies, not for crowning a multinational group. Wholesale-focused firms are excluded, so a large wholesale book will not appear just because the premium is big.
A free list is not a census. Absence from the Top 100 is not proof that an agency is small.
Submissions are voluntary, gaps are filled with public-source estimates, and the figures are not independently verified. Treat a missing regional name as a coverage limit, then check a licensing roll such as Texas insurance agencies when the question is who is licensed in a state rather than who sent in revenue.

4. AM Best Top 20 Global Insurance Brokers
AM Best's Best's Review ranks the top 20 global insurance brokers on total revenue, a different scope from any U.S. retail list. In the 2025 ranking, Marsh ranked first at approximately $26.98 billion, followed by Aon at $17.20 billion, Arthur J. Gallagher at $13.80 billion, and WTW at $9.71 billion, while the top 20 groups generated approximately $121.9 billion combined, as reported in Best's Review's global broker ranking.

Total revenue can include brokerage, reinsurance broking, consulting, risk management, and related services. It is not pure placement commission. Before you benchmark operating scale, split consolidated revenue from brokerage-segment revenue, and keep the ranking year attached to the figure. Acquisitions and currency effects move positions even when the underlying book is stable.
The global cut is the right peer set for a U.S. firm measured against worldwide groups. It is a poor tool for a small domestic agency. Detailed data may sit behind paid access. For a headcount contrast that revenue cannot supply, see how many Texas insurance agencies are still one-person shops.
5. Insurance Business 5-Star Brokerages
Ask who clients say they had a good year with, and a revenue table goes quiet. Insurance Business 5-Star Brokerages is a U.S.-region recognition list built from survey feedback by businesses about brokerage experiences over the prior 12 months. The score is a rating of client experience, not a dollar figure and not a headcount.
How to read it:
- Criterion: Business respondents' ratings, not brokerage revenue.
- Unit: The brokerage relationship as clients describe it, not the corporate group.
- Access: Free editorial pages online, with a U.S. region view.
- Limit: Not a complete or audited census of every brokerage.
A high rating does not mean the firm is large, and a large firm can be absent because few clients were surveyed. Check the edition year separately from the page refresh date. Those two dates are easy to conflate, and a stale survey should not be cited as this year's service record.

Client praise answers a service question. It does not answer a scale question, and it should not be graphed on the same axis as revenue.
6. Insurance Business Top Insurance Brokers and Agents
A personal recognition list measures a different unit from a brokerage ranking. Insurance Business's U.S. list of top insurance brokers and agents names individual professionals selected through reader nominations and survey feedback about advisory work and client service. The 2025 program used nominations and feedback gathered during a defined research window. Its editorial page is free.
Recognition reflects who was nominated and included, not the size of a firm or its revenue. A producer's absence therefore does not establish poor performance, just as inclusion does not show that their brokerage is among the largest.
The edition is tied to its research window, so check whether a newer one has replaced it before citing a name as current recognition. For producer counts rather than awards, licensing-based insurance producer count pages show how many producers are licensed in a state. That measure answers a workforce question, not who received recognition.

7. Insurance Journal Top Agency Partnerships
Independent agencies often sit inside a network, cluster, or franchise group. Ranking only the retail name misses that layer. Insurance Journal's Top Agency Partnerships report ranks the 20 largest U.S. agency partnerships by revenue and discusses networks, clusters, and franchise groups, including SIAA, FirstChoice, Smart Choice, Renaissance, and ISU Steadfast, with market context and growth strategies.
Use it when the question is how independent distribution is organized and where consolidation runs through a partnership rather than through a single brokerage's own book. Do not use it to rank retail agencies or individual brokerages. Partnership revenue is not the same measure as a member agency's own revenue, and adding the two double-counts the same premium from two angles.
The 2025 report is paid and may be overtaken by a later edition, so lock the edition year to any figure you repeat. It fills a niche standard broker lists skip, and it stays useful only if you keep the unit, the partnership, visible in the sentence.

7 Insurance Brokerage Rankings Compared
| Source | What it ranks | Measure used | Scope | Access |
|---|---|---|---|---|
| ProfessionLens, Insurance Agent Database | Insurance producer workforce counts, not a ranking | Aggregate counts from public licensing records | United States; profession and geography, with employer comparisons where available | Aggregate figures online; selected full datasets available as one-time CSV purchases |
| Business Insurance, U.S. Brokerage Revenue Rankings | Largest U.S. brokers | Year-end U.S. brokerage revenue | Top 100 U.S. brokers; also profiles the 10 largest global brokers | Detailed directory available in paid PDF and Excel editions |
| Insurance Journal, Top 100 Independent P/C Agencies | Independent retail property-and-casualty agencies | Total P/C agency revenue | 100 U.S. agencies; excludes wholesale-focused firms | Free online ranking |
| AM Best, Top 20 Global Insurance Brokers | Global insurance brokers | Total revenue | Top 20 worldwide, including major U.S.-based firms | Online coverage; detailed reports or data may require payment |
| Insurance Business, 5-Star Brokerages | Brokerages recognized for client experience | Business survey feedback about brokerage experiences | U.S. region | Free editorial content online |
| Insurance Business, Top Insurance Brokers and Agents | Individual brokers and agents | Reader nominations and survey feedback | United States; 2025 program | Free editorial ranking online |
| Insurance Journal, Top Agency Partnerships | Agency networks, clusters, and franchise groups | Revenue | 20 largest U.S. agency partnerships | Paid 2025 report |
Match the Measure to the Question, Then Cite It
The fastest way to misuse insurance brokerage rankings is to cite revenue as if it measured headcount, or survey recognition as if it measured scale. Before you quote any list, name its measure and its reference period. The measure might be brokerage revenue, total revenue, submitted agency revenue, survey votes, or licensed-producer counts. If you cannot say which of those you are holding, you are not ready to publish the rank.
Match the instrument to the sentence. A global total-revenue ordering benchmarks multinational groups and can fold in consulting and risk management. A U.S. brokerage-revenue directory is closer to domestic placement scale, and it still is not a quality score. An independent P/C agency list is narrower still, and it depends on who submitted. Survey lists record participation and client opinion. Partnership rankings describe networks, not member books.
When the question is workforce scale rather than firm size, licensing-based counts are the right instrument. We rank insurance carriers and producers from complete public licence rolls in states such as Florida and Texas, and we distinguish licensed, active, and appointed professionals instead of relying on submitted figures. Free count pages are citable with attribution. Full state lists support deeper cuts. The Texas insurance agents list of 279,727 people across 340,034 rows costs $249 one-time.
Whatever source you choose, the ranking is only as good as the fit between what it measures and what you need to know. Write the measure into the citation, keep the year beside the number, and do not let a familiar brand name do the work the denominator should do.
If you need producer and carrier counts you can cite, ProfessionLens publishes licensing-based research that separates scale from survey fame and from consolidated revenue. Our count pages and ranked lists are built for workforce and market questions that brokerage revenue tables leave open. Visit ProfessionLens to compare the figures against the question you have in mind.