Home / Blog / How Many Pharmacists in the US by Source
How Many Pharmacists in the US by Source
ProfessionLens, 2026-10-30
There are 328,832 pharmacists on the NPPES full replacement file dated September 15, 2026, and 321,970 employed pharmacists in the May 2025 BLS wage survey. These aren't the same measure: one counts provider-file records, while the other counts people employed in the occupation.
That difference matters when answering how many pharmacists are in the US. A federal provider record, a job, a modeled estimate of active supply, and a state license each describe a different population. None is a universal total of pharmacists who are currently available to serve patients.
Table of Contents
- Pharmacist Counts by Source in 2026
- Jobs, Records, Supply and Licenses
- Active Supply by Practice Setting
- Retail Losses and Hospital Gains
- Pay, Training and the 2035 Job Projection
- Pharmacists per Resident in a Community
- Pharmacists Beside Other Clinicians on One Date
- Choose the Count That Matches the Question
Pharmacist Counts by Source in 2026
The four national figures are 328,832 NPPES records, 321,970 employed pharmacists, about 325,200 pharmacist jobs, and 357,940 pharmacists in HRSA's active-supply model. Each row measures a different population, so the counts aren't samples of one another and must not be averaged.
| Source and date | Count | What is counted | What it is not |
|---|---|---|---|
| NPPES full replacement file, September 15, 2026 | 328,832 | Pharmacist records on the federal provider file | Proof that each person is currently employed as a pharmacist |
| BLS OEWS, May 2025 | 321,970 | Employed pharmacists in the wage survey | A count of every state license |
| BLS Occupational Outlook, 2025 | About 325,200 | Pharmacist jobs | The projected 2035 job count |
| HRSA active-supply model | 357,940 | Modeled active-supply headcount | Full-time-equivalent staffing or a license roll |
The BLS Occupational Employment and Wage Statistics survey reports 321,970 employed pharmacists in May 2025. That figure describes employment, not the number of records in a provider file or the number of licenses issued by boards.
The 328,832 NPPES figure is a count of pharmacist records in the September 15, 2026 file. It's useful when the question concerns the federal provider file, but a record alone doesn't establish that the person is currently working as a pharmacist. The BLS Occupational Outlook Handbook figure counts jobs, while HRSA's 357,940 is a modeled active-supply headcount. Their population definitions differ even before accounting for their reference periods.
When you cite a count, keep its definition and date attached. A number without those details can sound more precise than it is.
State license rolls don't solve the national-count problem. One pharmacist can hold licenses in multiple jurisdictions, so adding state totals would count licenses, not unique people. A licensed pharmacist may also not be employed in the occupation. For a defensible comparison, copy the number, source name, and reference date together. The next distinction to make is what each measure includes and excludes.
Jobs, Records, Supply and Licenses
A pharmacist job, an NPPES record, an HRSA active-supply estimate, and a state license measure different things. They can refer to overlapping people, but they are not interchangeable.
The BLS Occupational Outlook Handbook reports about 325,200 pharmacist jobs in 2025. That figure describes work in the labor market. NPPES counts records with a pharmacist taxonomy; its 328,832 records dated September 15, 2026 do not establish that every listed person is currently working as a pharmacist. Comparing the totals shows their scale, not a gap attributable to a specific group.
HRSA's active supply is a modeled headcount, not an employer payroll or a count of full-time-equivalent positions. The model draws on American Community Survey data, BLS occupational data, and HRSA projections. Because a headcount can include people working part time, it does not translate directly into staffing capacity.
Licenses count permissions, not jobs
Pharmacist licenses are issued by state and territorial boards, not through a single national licensing authority. The 2023–2024 NABP Report presents state-level licensing information and distinguishes licensees from pharmacists with in-state addresses. Its tables also separate practice settings, including community pharmacy, hospitals, manufacturing or wholesale, and teaching or government.
NABP reports that all 54 U.S. states and jurisdictions require the North American Pharmacist Licensure Examination. A shared examination requirement does not create one national license roll. A pharmacist licensed in two states appears on two rolls, while a license holder who is not currently employed may still count as a licensee.
NABP also records 17,480 NAPLEX administrations in 2023, down 5% from 18,466 in 2022. Administrations are not a count of new pharmacists because they include repeat attempts, and licensure rules differ by jurisdiction.
Public files still need quality checks
ProfessionLens counts licensed professionals using public and federal files, including NPPES, the CMS Doctors and Clinicians file, selected state rolls, and BLS OEWS. Public rolls can contain errors, duplicate records, or lapsed licenses. The source and extraction date therefore matter when interpreting a total. The guide to public licensed-professional data sources explains why different files answer different counting questions.
Active Supply by Practice Setting
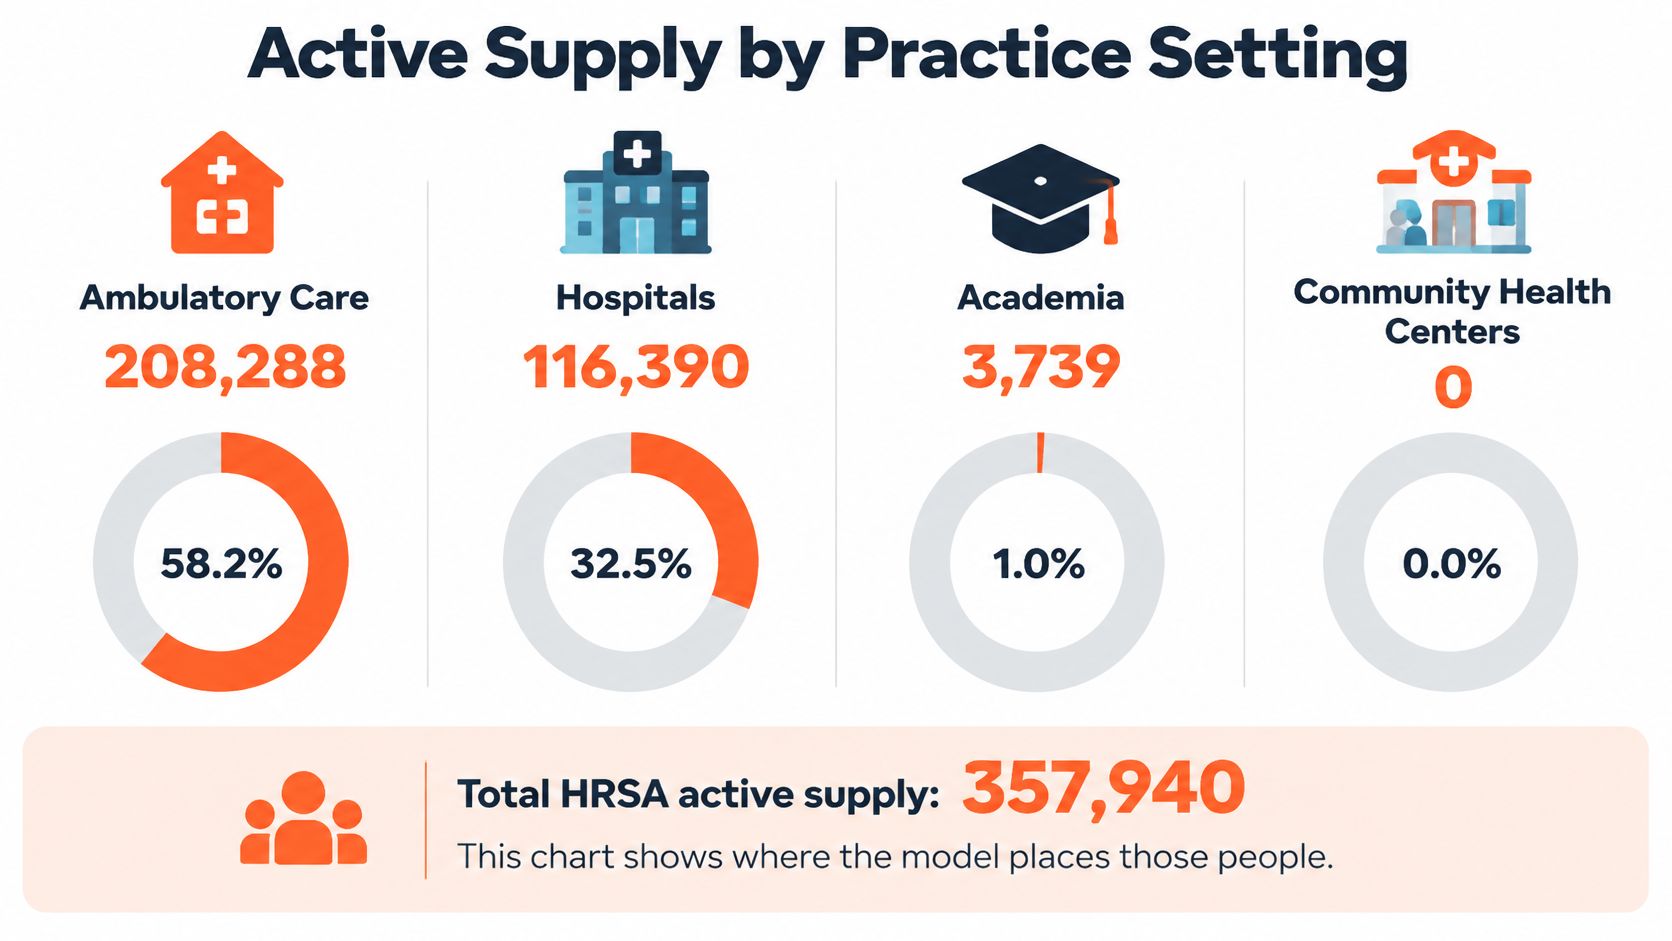
HRSA estimates active pharmacist supply at 357,940, divided among ambulatory care, hospitals, academia, and other settings. The model assigns 208,288 pharmacists to ambulatory care, 116,390 to hospitals, 3,739 to academia, and 29,523 to other settings. These are headcounts, not full-time-equivalent staffing totals.
| Setting | Headcount | Share of 357,940 | Measure |
|---|---|---|---|
| Ambulatory care | 208,288 | About 58% | Active-supply headcount |
| Hospitals | 116,390 | About 33% | Active-supply headcount |
| Academia | 3,739 | About 1% | Active-supply headcount |
| Other settings | 29,523 | About 8% | Active-supply headcount |
The HRSA workforce-model documentation describes the active-supply estimate and its allocation by practice setting. The table's shares are rounded calculations from the setting headcounts and model total.
Ambulatory care represents about 58% of modeled active supply, compared with about 33% in hospitals. Other settings account for about 8%, and academia about 1%. Rounded shares may not sum to exactly 100%.
The ambulatory-care category does not equal the number of pharmacists working behind community pharmacy counters. It is a modeled practice-setting category, not a measure of retail staff available to fill prescriptions in each neighborhood. HRSA's estimate combines data sources and a projection framework, so it does not match any single employer's payroll or state board license file.
For workforce reporting, describe the results as HRSA estimates: about 208,000 pharmacists in ambulatory-care headcount and 116,000 in hospital headcount. This keeps the setting-specific figures distinct from full-time staffing capacity.
Retail Losses and Hospital Gains
Retail pharmacist employment fell by about 8,200 positions to approximately 162,000 in 2025, while hospitals employed about 102,000 pharmacists after adding roughly 3,000 jobs. That contrast challenges the idea that a large national pharmacist count automatically means medication access is stable.
The Becker's Hospital Review report says retail employment reached its lowest reported level since 2010, while hospital employment continued to grow. These are employment figures by setting. They are not rows from HRSA's active-supply model, so the hospital employment estimate shouldn't be substituted for HRSA's hospital headcount.
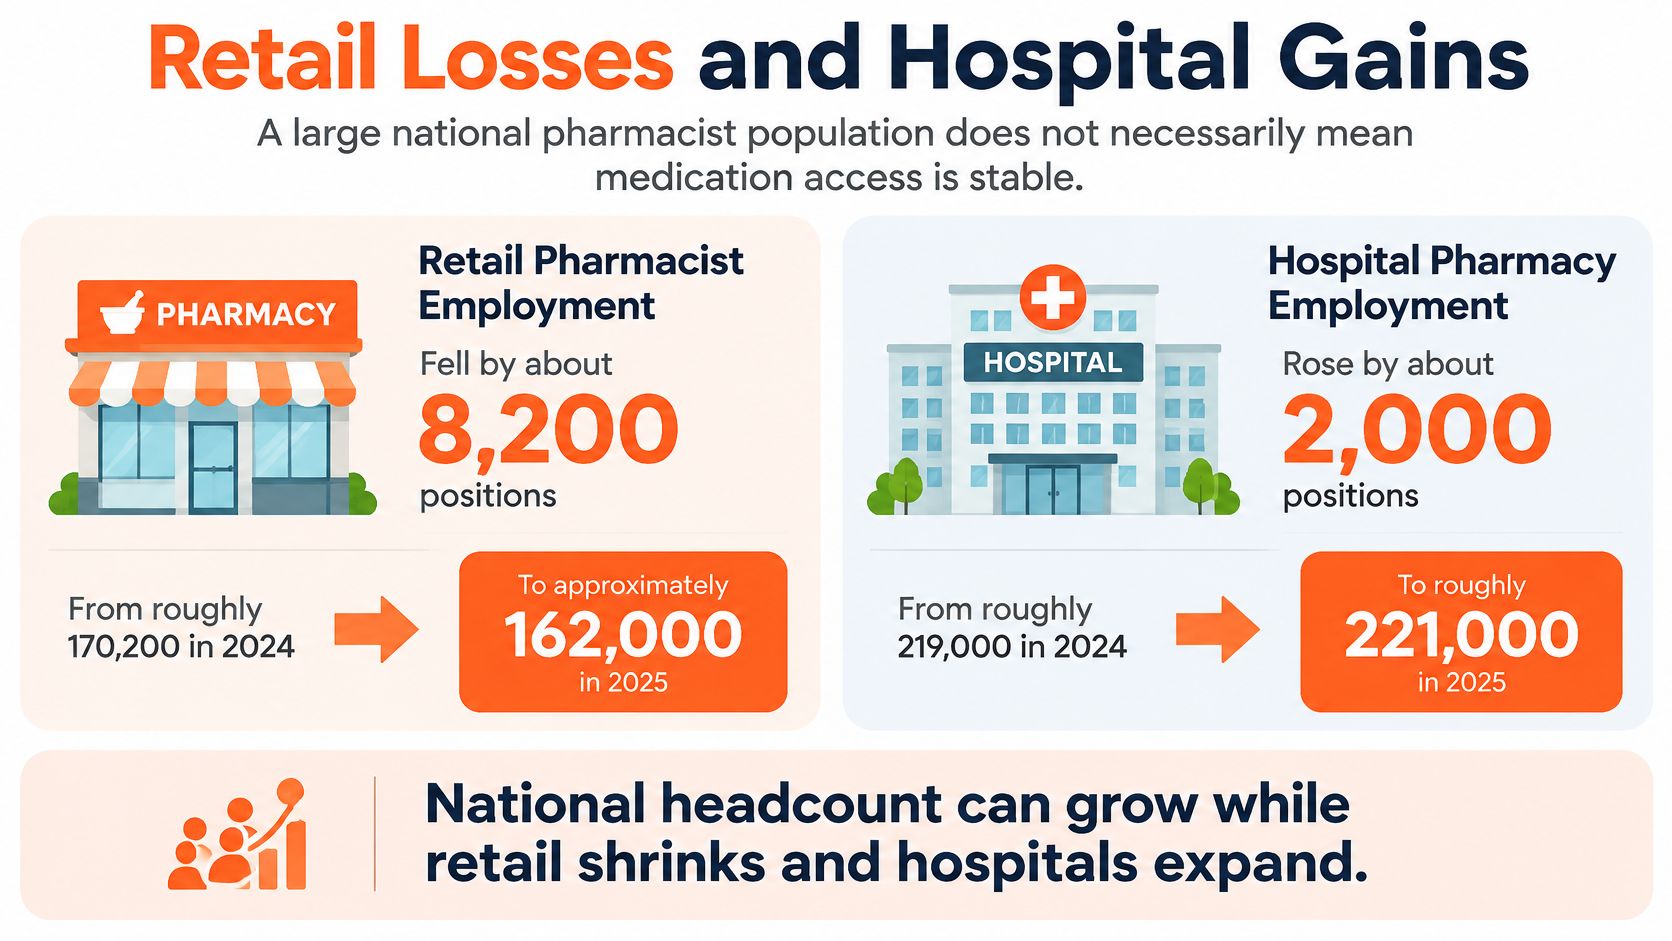
The practical issue is where pharmacists work, not just how many appear in a national file. Pharmacy closures and shifts in employment can leave a community with fewer accessible pharmacy counters even when the national workforce remains large. A hospital job may support medication care, but it doesn't replace a neighborhood retail pharmacy for someone who needs a nearby counter.
Geography can sharpen that point. In Illinois, only about one in ten licensed pharmacists reportedly practices in a rural location, even though 65 of the state's 102 counties are rural, according to the same report. That's a state license-and-location comparison, not a national employment count.
For access planning, ask how many pharmacists serve each community, and in what setting? Separate retail, hospital, ambulatory, mail-order, and other employment where possible. Then compare the relevant local count with the population and identify rural or pharmacy-desert exposure. A national headline count answers a question about size, not availability.
Pay, Training and the 2035 Job Projection
The BLS Occupational Outlook Handbook estimates 325,200 pharmacist jobs in 2025 and projects 342,300 jobs by 2035, an increase of 17,100 positions. The BLS pharmacist outlook projects 5% growth from 2025 to 2035, faster than the average for all occupations. The decade-long increase is about 5.3%, indicating moderate expansion.
The same occupational classification reports a mean annual wage of about $140,920 in May 2025. Pharmacists typically need a doctoral or professional degree for entry, with the Doctor of Pharmacy as the standard educational path. These employment, wage, and training measures describe the occupation, not the number of records in the NPPES provider file.
For hiring forecasts, cite jobs as jobs. Don't replace the BLS employment base with a provider-record total.
The projection indicates more pharmacist jobs by 2035. It does not specify how those jobs will divide between retail and hospitals or how they will be distributed among communities. A license can authorize practice without showing current employment, while an occupational projection estimates future jobs.
For workforce planning, keep the measures distinct: about 325,200 jobs in 2025, 342,300 jobs projected for 2035, and a mean annual wage of about $140,920 in May 2025. NPPES records answer a different question and should not replace the BLS employment figures.
Pharmacists per Resident in a Community
A national count can't tell a planner whether a particular county has enough pharmacists for local needs. To estimate local availability, calculate pharmacists per 100,000 residents using a count, setting, geography, and reference period that match the question.
- Choose the workforce measure. Use an employed-pharmacist count for a question about employment, or HRSA active supply when the question requires practice-setting detail. State which measure you selected.
- Select the relevant setting. If the question concerns community pharmacy, use a community-pharmacy count rather than combining it with hospital pharmacists. For hospital capacity, use the hospital measure.
- Match the geography and date. Get the resident population for the same area and, where possible, the same year as the pharmacist count. A county workforce count divided by a state population won't describe that county's density.
- Calculate the ratio. Divide the pharmacist count by the resident population, then multiply by 100,000. For example, a county with 25,000 residents and 4 community pharmacists would have 16 pharmacists per 100,000 residents. This is an illustration of the calculation, not a reported county statistic.
- Compare like with like. Set the result beside the state or a group of similar counties, using the same setting and workforce definition. A hospital-based ratio shouldn't be compared with a community-pharmacy ratio.
The denominator changes the meaning of the result. A raw count can make a populous county appear well supplied because it has more residents and more pharmacists. A per-resident ratio makes comparisons more useful, provided the count and population cover the same geography and period.
Add a rural flag when location affects access. The Illinois figures on rural practice illustrate why a statewide total can obscure where pharmacists are located. A comparison such as physicians per capita by state also shows the kind of population-normalized view that helps readers compare places, though it measures physicians rather than pharmacists.
The ratio won't capture every factor affecting access, such as travel distance or whether a pharmacy is open when patients need it. But it answers a more practical question than a national total alone: how many pharmacists serve a defined local population?
Pharmacists Beside Other Clinicians on One Date
On the September 15, 2026 NPPES file, there are 328,832 pharmacist records, fewer than 530,577 nurse practitioner records and more than 275,976 dentist records. Those figures compare provider-file records from one date, not employed workers or full-time clinical staffing.
The same NPPES file lists 1,272,256 physicians. Keep that as a separate profession count rather than subtracting or combining it with the pharmacist figure. The nurse practitioner count provides another same-date comparison, but it doesn't establish which profession has a shortage.
A ranking doesn't establish workforce adequacy. Each profession has its own taxonomy and licensing structure, and the share of records associated with full-time clinical work can differ. The CMS clinician file is a separate physician extract, so it isn't the comparison base for these NPPES figures.
If you need only the pharmacist figure, use the opening table and retain its population definition and date.
Choose the Count That Matches the Question
Choose a number by asking what you need to know. A provider-file question calls for the NPPES count; an employment question calls for BLS OEWS; a jobs question calls for the Occupational Outlook Handbook; and a practice-setting question can call for HRSA's active-supply model.
| Reader question | Number to cite | Population | Source and date |
|---|---|---|---|
| How many people the federal provider file lists as pharmacists | 328,832 | Pharmacist records | NPPES full replacement file, September 15, 2026 |
| How many pharmacists were employed | 321,970 | Employed pharmacists | BLS OEWS, May 2025 |
| How many pharmacist jobs existed | About 325,200 | Pharmacist jobs | BLS Occupational Outlook Handbook, 2025 |
| Where active supply sits | 357,940 | Active-supply headcount by setting | HRSA workforce model |
| How the occupation changes by 2035 | 342,300 jobs | Projected jobs; mean wage about $140,920 | BLS Occupational Outlook; May 2025 wage data |
| Whether a community has access | No national total | Local retail and hospital employment; rural practice | Local and state data |
For a repeatable citation, attach four pieces of information to the figure:
- Number: State the count you're using.
- Population: Say whether it means provider-file records, employed pharmacists, jobs, or active-supply headcount.
- Source: Name NPPES, BLS OEWS, the BLS Occupational Outlook Handbook, or the HRSA workforce model.
- Date: Include the file date or reference period, such as September 15, 2026, May 2025, or 2025.
Don't add rows from different populations or dates to create a new national total. The figures overlap in purpose and may describe some of the same people, but the source definitions don't make them additive. The NPPES count can be checked against the public federal file on its stated date; reporting that date lets another reader repeat the pull.
If your question is whether a particular community has access, no national total is the right citation. Use the local setting and geography that match the question, then compare the count with the resident population. ProfessionLens is a research site that counts licensed professionals and executive titles in the United States by profession, geography, and employer, using public licensing records and federal statistics.
If you're comparing pharmacist counts by source, state, or employer, use the population definition and reference date that fit your question. Visit ProfessionLens to explore its professional count pages, ranked lists, and workforce research reports.